
Introduction
One of the waste streams in the world that is expanding the fastest is e-waste, often known as electrical and electronic equipment waste or electronic waste. That high and quick generation is influenced by decreasing sale prices, rising technological innovation, and shorter equipment life spans1. Hazardous materials and rare and valuable metals make up e-waste. Because certain groups of people make money from the dangerous disassembly and resale of electronic waste, proper disposal of this waste poses a threat to the environment. In this regard, the effectiveness of programs for the selective collection of e-waste and environmental preservation depends on how families handle and dispose of outdated and unwanted equipment.
In many nations, improper handling and disposal of e-waste is a widespread issue. According to Bigum et al.2, batteries and lost electronic waste made up 39% and 16% of residual waste in Danish towns, respectively. However, the issue of disposing of common waste and e-waste in developing nations is a big concern3,4. This is because such waste is highly valued in the black market, where it is dangerously disassembled from outdated equipment, releasing harmful elements into the environment.
One of the most crucial elements in a successful management plan for this kind of waste is public involvement in the appropriate separation and disposal of e-waste. Families in India have been known to store, exchange, and resell electronic waste in addition to disposing of it with regular waste 5.
Furthermore, disposing of e-waste produced by various EEE products in landfills harms the ecosystem. For instance, the disposal of computer waste and numerous other electronic devices in landfills leads to the generation of contaminated leachates, which consequently causes pollution of groundwater. Additionally, the melting of computer chips generates acids and sludge, which, if dumped on the ground, causes soil acidification6. A single cell phone battery contains enough cadmium, according to Polak et al.7, to contaminate 600,000 liters of water. E-waste incineration may also release harmful chemicals into the atmosphere, which contaminates the air6. Additionally, the unregulated recycling of e-waste results in elevated concentrations of particulate matter (PM10) in the air, posing a persistent risk to human and animal health due to air pollution from informal e-waste treatment8. Lundgren et al.,9 reports that a number of studies carried out in China demonstrated that the basic recycling equipment used for processing large amounts of e-waste was significantly linked to adverse environmental effects, such as soil and surface water contamination, in addition to health issues affecting people. Furthermore, as air pollution can spread thousands of miles from recycling sites to other populated regions, inappropriate e-waste deconstruction and burning practices can lead to secondary exposure. The improper processing and disposal of e-waste increases the danger of contaminating the food chain since livestock may consume the toxins that accumulate in agricultural areas as a result of e-waste. Furthermore, the majority of the harmful chemicals detected in e-waste have a sluggish metabolic rate in animals, which can lead to bioaccumulation in their organs and have an impact on food products like eggs, according to a study by Lundgren et al.9.
According to a study conducted in America, e-waste disposal practises cannot be properly facilitated by educational interventions alone10. Policymakers and experts in waste management are encouraged to support free or inexpensive recycling techniques10. According to Wang et al. 11, a further study conducted in China demonstrated the significance of incorporating suitable e-waste practices within the legal framework. Additionally, it was discovered that although consumers are concerned about the environment, they are not aware of the laws, regulations, and programs that are in place to properly handle e-waste11. According to Yin et al.12 study and analysis, Willingness to Pay (WTP) may have an impact on consumers’ recycling habits when it comes to mobile phones. According to Yin et al.12, 47.9% of consumers consented to pay for the recycling of smart phones. Customers’ awareness of environmental degradation affected their willingness to pay (WTP) for high-end, “green” cell phones, according to a Nigerian study. 65 percent of the population, according to their study, were “willing” or “very willing” to recycle13. In a research centred on the US, Saphores et al.14 examined how raising recycling awareness, moral standards, and putting in place a convenient, safe formal recycling system may all help consumers recycle more e-waste. In the US, about 70.1% of participants expressed a moral need to recycle in order to save the environment14.
This study uses a semi-structured questionnaire and statistical analysis to look at the e-waste management practices and knowledge of Indian families living in a middle-class in the NCR Region.
Material and methods
Study area
Individuals from the NCR Region were selected to conduct all of the analyses. The participants were chosen from middle-class families predominate in the area; as a result, it is anticipated that people living in these neighborhoods will use electronic devices and produce e-waste in a comparable manner. Additionally, the research findings are more conservative because middle-class households have more purchasing power, greater access to electronic products, and as a result, produce more e-waste.
Survey Procedures and Sampling Framework
The purpose of this survey was to find out how much information households in the NCR knew about e-waste and associated topics. The participants in this survey were chosen at random from the NCR. The primary subjects of in-person questionnaire-administered interviews were heads of households. Our survey’s random sampling strategy was designed to increase statistical validity and data represent ability, which is consistent with earlier studies that looked into citizens’ attitudes and actions regarding recycling e-waste in Beijing, China15. Furthermore, Bhat and Patil,16 used a random sample strategy in their quest to comprehend Pune, India, inhabitants’ disposal habits and consciousness. During our study, 300 questionnaires were distributed to household respondents; however, only 240 of those were properly filled out, resulting in a 80% response rate. The majority of these interviews took place in English, but when participants had trouble comprehending the questions, they were translated into “HINDI,” the indigenous language of the area.
Data collection and analysis
Between January 2023 and April 2023, the survey conducted interviews to gather primarily quantitative primary data. The closed-ended questions on the questionnaires were divided into four areas, which can be summed up as follows:
- The respondents’ socioeconomic and demographic attributes.
- Awareness and knowledge of electronic waste.
- The reasons for switching to new electronics.
- Environmental issues related to the treatment of e-waste.
MS Excel (Version 2016) was used to save the primary data gathered from the interviews so that it could be processed and coded later. The SPSS 22 version was then used to apply both descriptive and inferential statistical analysis to the data17,18. Correlation study performed between awareness and willingness for e-waste management parameter represented by FA1, FA2, FA3, FA4, FA5, FA6, FA7, FA8 and FA9.
Result and Discussion
Demographic and Socioeconomic Characteristics of Respondents
The respondents’ demographic information is compiled in Table 1. Men made up 75.83% (n = 182) of the 240 respondents, while women made up 24.16% (n = 58). The significant under representation of women is hardly surprising, given that we exclusively spoke with traditionally male household heads for our interviews. The age group of 21 to 30 years old accounted for the largest percentage of respondents (51.66%; n = 124). The majority of respondents (90%; n = 216) were educated, but a smaller percentage (10%; n = 24) uneducated. Regarding marital status, the majority of respondents (70%; n = 168) were married, while only 30% (n = 72) were single.
Table 1- Demographic profile of the respondents
| Variables | Category | Percentage % | N |
| Gender | Male | 75.83% | 182 |
| Female | 24.16% | 58 | |
| Age | 21-30 | 51.66% | 124 |
| 31-40 | 27.5% | 66 | |
| 41-50 | 12.5% | 30 | |
| Above 51 | 8.33% | 20 | |
| Marital status | Married | 70% | 168 |
| Unmarried | 30% | 72 | |
| Education | Educated | 90% | 216 |
| Not educated | 10% | 24 |
Even though the respondents’ occupation varied in almost equal amounts (9.16% for informal trading and 10% for others), the majority of them worked as civil workers (50%; n = 120) (Table- 2). In terms of family size, households with three to four or five to six people were represented by 36 % (n = 88) and 23.33% (n = 56) of respondents, respectively, but families with seven or more people were only represented by 20% (n = 48) of the respondents. Family size may indicate how many electronics and gadgets the respondents would likely purchase and how much e-waste to anticipate, depending on their ages and income levels.
Table 2- Socioeconomic characteristics of the respondents
| Aspects | Components | Percentage % | N |
| Occupation | Informal trading | 9.16% | 22 |
| Civil | 50% | 120 | |
| Farming | 19.58% | 47 | |
| Students | 11.26% | 27 | |
| Others | 10% | 24 | |
| Family size | 1-2 person | 20% | 48 |
| 3-4 person | 36% | 88 | |
| 5-6 person | 23.33% | 56 | |
| 7- Above | 20% | 48 |
Knowledge and Awareness of Electronic Wastes
The percentages of various electronic device kinds utilized by family members are shown in Figure 1. Most respondents mentioned both television sets (85%) and cell phones (95%) in their responses. Cell phones are among the most common and essential electronic devices in homes today, according to a study done in Onitsha, Nigeria, by Okoye and Odoh19.
Additionally, almost equal numbers of respondents reported having a radio (50%), laptop (62%), DVD player (55%), kitchen appliance (52%), and refrigerator (70%). Although several electronic items in our survey were least cited by the respondents, a study done in India Nethaji et al.20 claims that rising economic growth can be attributed to greater purchasing of electronic devices. These included desktop computers (50%), and food warming equipment (microwaves) (29%). No matter what kind of electronic products are purchased for the home, Saritha et al.21 point out that eventually their lifespan will come to an end, requiring them to be disposed of. In a study conducted in India, Alam and Bahaddin,22 found that rising economic growth and revenue earned are related to the buying of electronic devices. But no matter what kind of electronic equipment is purchased, these eventually approach the end of their useful lives and must be disposed of.

Figure 1- Electronic devices mentioned by respondents..
Table 3 shows that while 68% (n = 155) of respondents said they had not received comprehensive instruction on how to handle and dispose of this waste stream 157 of respondents are aware of e-wastes. Many developing nations, including Nigeria and others, lack the institutional support and resources necessary to expand the transmission of relevant knowledge on e-waste, which is why many people do not receive education on e-waste handling protocols19, 23, 24. Despite these drawbacks, a large number of respondents indicated that they are aware of the waste stream’s toxicity or harmfulness 69 and the inherent health risks 142 connected to improper disposal methods. As a result, they recognize the need for special handling to ensure safe disposal (59%). In contrast, a different study carried out in Nigeria’s Enugu West Senatorial District has likewise documented comparatively greater levels of household awareness regarding e-waste25. As a result, 90.4% (n = 218) of respondents in the current survey felt that e-waste sorting is crucial (Table 3).According to a study conducted in China, the participants exhibit a strong sense of environmental awareness, but they lack knowledge of laws pertaining to e-waste, recycling initiatives, and the formal and informal recycling industries 26. The management of e-waste requires perception, knowledge, and extensive e-waste education—all of which are frequently lacking in developing nations like South Africa, and India, where institutional resources and support are scarce for the spread of appropriate e-waste disposal practices27,28. Despite the limitations associated with e-waste, a resounding 90.4% of respondents agreed that sorting e-waste is crucial to the province’s waste management process.
Table 3- Statements measuring respondents awareness and knowledge about e-waste
| Questions for E-Waste Knowledge and Awareness | No | Yes |
| Are you aware of what electronic waste, or e-waste, is? | 83 | 157 |
| Are you aware that e-waste needs to be treated differently before being disposed of? | 112 | 128 |
| Are you aware of the negative environmental effects of improperly disposing of e-waste? | 71 | 169 |
| Do you know that hazardous materials can be found in e-waste? | 171 | 69 |
| Do you know what health risks electronic waste poses? | 98 | 142 |
| Have you previously received e-waste education? | 178 | 62 |
| Do you believe that better waste management requires categorizing e-waste? | 22 | 218 |
The results of the various sources used by NCR residents to learn about e-waste at the household level are displayed in Figure 2. To a wider extent, comparatively fewer respondents highlighted the majority of the knowledge sources on e-waste, which included schools (17.50%), television (10%), and workplaces (7.50%). Furthermore, even fewer respondents identified additional learning resources, such as information from local awareness programs (5.10%) and national or community radios (5%; n = 12). However, the percentage of respondents who have not been exposed to any e-waste learning sources was significantly higher (30%; n = 72), indicating that e-waste learning is often not given much emphasis in the study area.

Figure 2- Sources of learning about e-waste among respondents
Motives for Changing Electronic Products
There are a variety of motivations to upgrade or buy new electronics, and Figure 3 summarizes the findings related to these factors. The majority of respondents firmly agreed that product damage (39.1%), upgrades (34.1%), theft (28.70%), and the release of newer designs (26.3%) were the primary reasons they were purchasing electronic equipment. These results support the findings of Saritha et al.21, who concluded that the launch of fresh product designs and the occurrence of faults on older products accelerate the purchase of electronic goods. Figure 3 makes clear that there are four main factors that affect respondents decisions to switch to new electronic devices: theft, product updates, damage, and new designs. When purchasing electronic devices, the idea of social identity refers to how useful it is to be associated with a social group and feel pressured by peers and social groups to make use of these products29. Social attachment drives the consumer to act in a way consistent with their social class30. Customers want to buy brands that correspond with their social standing31,32.

Figure 3 Reasons for changing electronic devices
The many approaches to managing and getting rid of e-waste in the research area are shown in Figure 4. The same proportion of respondents are either dumping and combining e-waste with regular household garbage (27%; n = 65) or just storing it in their houses (25%; n = 60). The metropolis’s lack of a door-to-door collection programme likely makes e-waste storage at home more common.
Due to the dearth of practical options for properly disposing of it or recovering it for other uses, such household storage of e-waste has also been documented in other research33,34. Residents of the study region are likely to dispose of their electronic garbage outside of their homes due to the current state of affairs, which is consistent with the findings of previous Nigerian researchers who have attested to inadequate e-waste management practices.
Figure 4 also demonstrates that a portion of the e-waste is sold to private citizens (15%; n = 36) for potential reuse, which is a comparatively more environmentally friendly method of handling this waste stream. Keeping this e-waste as a storing in the house is the next most popular approach, utilized by households, at 25%. This may be explained by the province’s lack of door-to-door e-waste collectors. Other studies have also documented storing e-waste at home due to a lack of practical choices32. Additionally, e-waste is either thrown away at surrounding dumpsites (9%) or burned at the household level (10%; n = 24), which contributes to local air pollution in the neighbourhood of households (Fig 4). Nonetheless, a portion of the e-waste is donated (15%; n = 36) to individuals in need or sold to recyclers (8% ), though these percentages are still quite low when considering the majority of environmentally unsound methods used in the processing and disposal of these wastes.
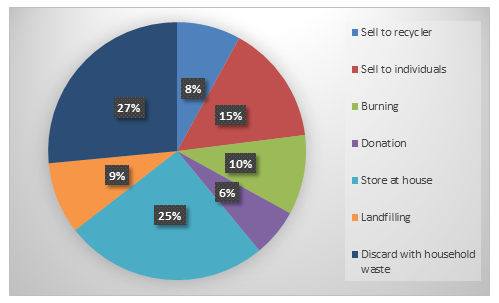
Figure 4 -Process of handling and disposing away e-waste by households
Environmental Problems Associated with E-Waste Management
According to Figure 5, almost similar numbers of respondents thought that e-waste was an important source of fugitive atmospheric emissions, with 15% to 33.1%, while the majority thought it was an eyesore in the study region, ranging from extremely serious (34.1% ) to serious (17% ). Similarly, improper handling of e-waste in the research region is linked to both major (29.1%) and very serious (29.1%) ineffective municipal solid waste management, as well as being held accountable for causing illnesses in humans.

Figure 5 E-waste management related Environmental problems
Households’ Willingness to Participate in E-Waste Management
Table 4 displays the findings on household participation in e-waste management. The many statements (Table 4) that were given to the respondents during the survey served as the basis for determining this willingness. The majority of respondents (65%; n = 156) expressed a readiness to pay for the appropriate disposal of electronic waste. The local governments may be able to increase collection rates and the efficiency of e-waste recycling in the research region by offering drop-off sites with such rewards, contingent on their willingness and degree of commitment. This observed readiness to pay for e-waste disposal, however, is in contrast to research conducted on Californian families (USA), where some households indicated that they would be reluctant to pay additional fees for efficient e-waste disposal35. In addition, a majority (85%; n = 204) acknowledged the need for greater education to raise awareness and knowledge levels.Similarly, producers and suppliers of electronic goods perceived the extended producer responsibility (EPR) policy (81%; n = 194) as a workable strategy for disposing of e-waste in a comparatively more efficient manner. However, assessing the effectiveness of such an intervention will necessitate more cooperation and participation with other pertinent parties, particularly those who will fund its execution and logistical planning. Tarawneh and Saidan,36 studied that a large portion of the sample that responded lacked awareness and understanding regarding e-waste. More than half of the sample that responded did, however, recognize the significance of recovering valuable components from e-waste. An investigation of the destiny of e-waste based on consumer behaviour revealed that, should cost-effective management policies be implemented, e-waste generation may alter. primarily because the majority of the population (more than 90%) expressed a strong desire to manage e-waste.
Table 4- Respondents willingness to take part in the management of e-waste
| Willingness to Take Part in the Management of E-Waste | Yes | No |
| In order to have your electronic Waste disposed of properly, would you be willing to pay a small fee? | 65% | 35% |
| Do you believe that initiatives like expanded producer responsibility may improve your e-waste management? | 81% | 19% |
| Are you willing to participate in such programs? | 82% | 18% |
| Would you favour increased e-waste education and awareness? | 85% | 15% |
Table 5 – Correlation study
| FA1 | FA2 | FA3 | FA4 | FA5 | FA6 | FA7 | FA8 | FA9 | |
| FA1 | 1 | ||||||||
| FA2 | 0.94 | 1 | |||||||
| FA3 | 0.85 | 0.8 | 1 | ||||||
| FA4 | 0.88 | 0.7 | 0.81 | 1 | |||||
| FA5 | 0.79 | 0.6 | 0.73 | 0.71 | 1 | ||||
| FA6 | 0.68 | 0.45 | 0.59 | 0.45 | 0.54 | 1 | |||
| FA7 | 0.60 | 0.5 | 0.87 | 0.48 | 0.43 | 0.73 | 1 | ||
| FA8 | 0.83 | 0.66 | 0.71 | 0.55 | 0.71 | 0.88 | 0.93 | 1 | |
| FA9 | 0.71 | 0.49 | 0.57 | 0.85 | 0.91 | 0.59 | 0.74 | 0.91 | 1 |
(FA1-Education ; FA2- Aware of what is electronic waste; FA3- Aware that e-waste needs to be treated differently before being disposed of; FA4- Aware of the negative environmental effects of improperly disposing of e-waste; FA5- Health risks electronic waste poses; FA6- Willing to pay a token; FA7- EPR helpful in managing e-waste; FA8- Willing to participate in EPR; FA9- Want more education and awareness about e-waste)
The correlation between awareness, education, willingness, and e-waste management practices (Table-5). The study showed strong positive relation between educated respondents and awareness and their willingness to participate in e-waste management. Sustainable practices depend critically on the relationship between education levels and awareness/willingness to manage e-waste. The present study reveals that individuals with education frequently demonstrate greater knowledge of the effects/ toxicity of e-waste on the environment and human. A knowledgeable educational background seems to be associated with an increased awareness of the potentially harmful elements found in electronic waste and the need for appropriate disposal.
Moreover, there is a tendency for a greater willingness to participate in e-waste management programs to be correlated with higher education. People with higher levels of education are more likely to use eco-friendly disposal techniques like recycling and joining e-waste collection programs and EPR.
Conclusion
Through this survey, the researchers aimed to ascertain the degree of awareness among study participants and their willingness to participate in a study on the management of e-waste in NCR. We can draw the conclusion that minimizing the current state of environmental issues will require careful trash disposal, reuse, and recycling. The study’s suggestions can be inferred from this conclusion: With 182 men participating, the houses surveyed (240) were predominately male. 58 women took part in the study at the same time. The most represented age groups were under 21–30 years. Mobile/cell phones (95%) were the most common electronic goods owned by family members, followed by TVs (85%), refrigerators (70%), laptops (62%), and DVD (55%). The study also found that most of the study participants had higher levels of awareness. For instance, 62 of survey participants reported having never received any kind of e-waste management education, which could be harmful to reducing the issue in NCR City and other parts of the nation. In their attempts to combat e-waste, the community and local agencies are hampered by this vulnerability. To solve this problem, family members’ awareness of proper e-waste management techniques must be raised. As a result, community-based interventions may play a crucial role in raising community members’ comprehension of this issue.
Competing Interests- Authors have declared that no competing interests exist
References
- Franco R.G.F., Lange L.C. 2011. Estimativa do fluxo dos resíduos de equipamentos elétricos e eletrônicos no município de Belo Horizonte, Minas Gerais, Brasil, Eng. Sanit. Ambient, 16 , pp. 73-82,
- Bigum M., Petersen C., Christensen T.H., Scheutz C 2013. WEEE and portable batteries in residual household waste: Quantification and characterisation of misplaced waste, Waste Manage., 33, pp. 2372-2380,
- Baidya R., Debnath B., Ghosh S.K., Rhee S.-W. 2020. Supply chain analysis of e-waste processing plants in developing countries, Waste Manage. Res., 38, pp. 173-183,
- Oliveira J.D., Oliveira-Neto J.F., Mendonça Silva M., Santos S.M. 2020 E-waste mistakenly disposed of as recyclable waste: A case study from Brazil, CLEAN – Soil Air Water, 48, Article 2000115
- Borthakur A. 2015.Generation and management of electronic waste in India, J. Dev. Soc., 31, pp. 220-248
- Sankhla, M.S.; Nandan, M.; Mohril, S.; Singh, G.P.; Chaturvedi, B.; Kumar, R.; Kumari, M. 2016. Effect of Electronic waste on Environmental & Human health—A Review. IOSR J. Environ. Sci. Toxicol. Food Technol. 10, 98–104.
- Polak, M.; Drápalová, L. 2012. Estimation of end of life mobile phones generation: The case study of the Czech Republic. Waste Manag. 32, 1583–1591.
- Gangwar, C.; Choudhari, R.; Chauhan, A.; Kumar, A.; Singh, A.; Tripathi, A. 2019. Assessment of air pollution caused by illegal e-waste burning to evaluate the human health risk. Environ. Int.125, 191–199.
- Lundgren, K. 2012. The global impact of e-waste: Addressing the challenge; International Labour Organization: Geneva, Switzerland.
- Arain, A. L., Pummill, R., Adu-Brimpong, J., Becker, S., Green, M., Ilardi, M., … & Neitzel, R. L. 2020. Analysis of e-waste recycling behavior based on survey at a Midwestern US University. Waste Management, 105, 119-127.
- Wang, B., Ren, C., Dong, X., Zhang, B., & Wang, Z. 2019. Determinants shaping willingness towards on-line recycling behaviour: An empirical study of household e-waste recycling in China. Resources, Conservation and Recycling, 143, 218-225.
- Yin, J., Gao, Y., & Xu, H. 2014. Survey and analysis of consumers’ behaviour of waste mobile phone recycling in China. Journal of Cleaner Production, 65, 517-525.
- Nnorom, I. C., Ohakwe, J., & Osibanjo, O. 2009. Survey of willingness of residents to participate in electronic waste recycling in Nigeria–A case study of mobile phone recycling. Journal of cleaner production, 17(18), 1629-1637.
- Saphores, J. D. M., Ogunseitan, O. A., & Shapiro, A. A. 2012. Willingness to engage in a pro-environmental behavior: An analysis of e-waste recycling based on a national survey of US households. Resources, conservation and recycling, 60, 49-63.
- Wang, Z.; Zhang, B.; Yin, J.; Zhang, X. 2011. Willingness and behaviour towards e-waste recycling for residents in Beijing city, China. J. Clean. Prod.19, 977–984
- Bhat, V.; Patil, Y. 2014. E-waste consciousness and disposal practices among residents of Pune city. Procedia Soc. Behav. Sci. 133, 491–498
- Yadav, S., Dhankhar, R., & Chhikara, S. K. 2022. Significant Changes in Urban Air Quality during Covid-19 Pandemic Lockdown in Rohtak City, India. Asian Journal of Chemistry, 3189-3196.
- Yadav, S., Bajar, S., Hemraj, Rohilla, R., Chhikara, S. K., & Dhankhar, R. 2023. Assessment of groundwater quality near municipal solid waste landfill by using multivariate statistical technique and GIS: a case study of Bandhwari (Gurugram) landfill site, Haryana, India. Sustainable Water Resources Management, 9(6), 174.
- Okoye, A.; Odoh, C. 2014. Assessment of the level of awareness of E-Waste management and concern for the environment amongst the Populace in Onitsha, South Eastern Nigeria. J. Environ. Prot. 5, 120–134.
- Nethaji-Mariappan, V.E.; Karthik, S.; Vineeth, K.S.; Varthamanan, S. 2017. E-Waste Management & Assessment—A Review. Int. J. ChemTech Res. 10, 924–936
- Saritha, V.; Sunil Kumar, K.A.; Srikanth, V.N. 2015. Consumer attitudes and perceptions on electronic waste: An assessment. Pollution, 1, 31–43.
- Alam, M., & Bahauddin, K. 2015. Electronic waste in Bangladesh: evaluating the situation, legislation and policy and way forward with strategy and approach. Present Environment and Sustainable Development, (1), 81-102.
- Jafari, A.; Heydari, J.; Keramati, A. 2017. Factors affecting incentive dependency of residents to participate in e-waste recycling: A case study on adoption of e-waste reverse supply chain in Iran. Environ. Dev. Sustain. 19, 325–338.
- Akhtar, R.; Masud, M.M.; Afroz, R. 2013. Household Perception and Recycling Behaviour On Electronic. Malays. J. Sci. 33, 32–41.
- Umaebolu, E.I. 2018. Fate of e-waste in households in EnuguWest Senatorial district of Enugu State, Southeast Nigeria. Int. J. Community Med. Public Health, 5, 4200–4206.
- Ramzan, S., Liu, C., Munir, H. et al. 2019.Assessing young consumers’ awareness and participation in sustainable e-waste management practices: a survey study in Northwest China. Environ Sci Pollut Res 26, 20003–20013.
- Wang, B.; Zhang, D. 2016. Take responsibility for electronic-waste disposal. Nat. News, 536, 23–25
- Machete, F. 2017. Environmental health risks associated with e-waste exposure in Badplaas, Carolina and Elukwatini landfills, Republic of South Africa. Afr. J. Sci. Tech. Innov. Dev, 9, 679–684.
- Biswas, A.; Roy, M. 2015. Green Products: An exploratory study on the consumer behaviour in emerging economies of the East. J. Clean. Prod. 87, 463–468.
- Candan, B.; Yildirim, S. 2013. Investigating the relationship between consumption values and personal values of green product buyers. Int. J. Econ. Manag. Sci. 2, 29–40.
- Lee, C.K.C.; Deborah, S.L.; Yap, C.S.F. 2015. How does the theory of consumption values contribute to place identity and sustainable consumption? Int. J. Con. Stud. 39, 597–607.
- Uhunamure, S. E., Nethengwe, N. S., Shale, K., Mudau, V., & Mokgoebo, M.2021. Appraisal of Households’ Knowledge and Perception towards E-Waste Management in Limpopo Province, South Africa. Recycling, 6(2), 39.
- Shah, A. 2014. An Assessment of Public Awareness Regarding E-Waste Hazards and Management Strategies (2014). Independent Study Project (ISP) Collection. 1820. Available online:
- Borthakur, A.; Sinha, K. 2013. Electronic waste management in India: A Stakeholder’s Perspective. Electron. Green J. 1, 36.
- Nixon, H.; Saphores, J.-D.M. 2007. Financing electronic waste recycling Californian households’ willingness to pay advanced recycling fees. J. Environ. Manag. 84, 547–559.
- Tarawneh, A., & Saidan, M. 2013. Households awareness, behaviors, and willingness to participate in E-waste management in Jordan. International journal of ecosystem, 3(5), 124-131.