
Introduction
In recent decades, the formation and stability of mixed-ligand or ternary complexes have received increased attention, particularly with transition and rare earth elements. Rare earth complexes, especially those involving erbium (Er³⁺), present unique challenges due to their low molar absorptivity, f–f electronic transitions, and limited variation in spectral features resulting from the shielding of 4f orbitals.
Despite these limitations, ternary complexes of erbium are analytically valuable. Their spectrophotometric behavior, particularly the hyperchromic effect, can be used for sensitive detection and microdetermination. The present work investigates Er³⁺ complexes with primary hexadentate ligands (EDTA, HEDTA, CYDTA, and EGTA) and secondary bidentate ligands (maltol, tiron, kojic acid, and α-picolinic acid). The study analyzes molar absorptivity changes, determines stoichiometry and stability constants, and discusses ligand preferences and their analytical implications.
Expanded Materials and Methods
Reagents and Solutions
- Erbium(III) solution was prepared by dissolving high-purity Er₂O₃ (99.9%) in dilute nitric acid. The solution was heated gently, cooled, diluted, and standardized by titration with EDTA using xylenol orange as an indicator (pH ~5.5).
- Primary Ligands (0.1 M):
- EDTA: Prepared using Merck disodium dihydrate, dried at 80°C.
- HEDTA, CYDTA, and EGTA: Commercial grade (Fluka), dissolved using minimal dilute ammonia.
- Standardization: Done via titration against standard Zn²⁺ using Eriochrome Black T.
- Secondary Ligands (0.1 M):
- Maltol: Crystallized from ethanol.
- Tiron: Used as received.
- Kojic acid: Recrystallized with charcoal filtration.
- α-Picolinic acid: AR grade.
- Standard Zinc Solution (0.1 M): Prepared using BDG Analar zinc pellets in HCl and diluted to volume.
Instrumentation
- Spectrophotometer: Hitachi 330 automatic recording spectrophotometer
- Wavelength range: 187–2500 nm
- Accuracy: ±0.2 nm
- Scan speed: 60 nm/min
- Slit width: 2 nm
- λmax for Er³⁺ ternary complexes: 379 nm
- pH Meter: M64 Research grade; accuracy ±0.02 pH units.
Procedure for Complex Formation and Analysis
- Preparation of Primary Complexes: Equimolar solutions of erbium and primary ligand were mixed (1 × 10⁻² M each) and adjusted to pH 8.0 using 15% triethanolamine solution.
- Ternary Complex Formation: Increasing concentrations of secondary ligand (4 × 10⁻³ to 3 × 10⁻² M) were added to the erbium-primary ligand mixture. Solutions were brought to 10 mL total volume and analyzed immediately.
- Spectral Recording: UV-visible spectra were recorded from 350–450 nm. Absorbance at λmax (379 nm) was used to calculate molar extinction coefficients.
- Determination of Stoichiometry and Extinction Coefficients:
- Modified Molar Ratio Method was employed to plot absorbance against [Ls]/[Ln-Y].
- Ep (binary) and Em (ternary) molar extinction coefficients calculated using Lambert-Beer’s Law:
A = ε × C × L
- Stability Constants:
- Calculated using absorbance data and the formula:
Ks₁ = x / (p – x)(b – x)
where x = ternary complex conc., p = primary complex conc., b = secondary ligand conc. - Corrected using ligand pKₕ values to determine affinity parameter A = log Ks₁ / pKₕ.
- Calculated using absorbance data and the formula:
Results and Discussion
Stoichiometry of Complexes
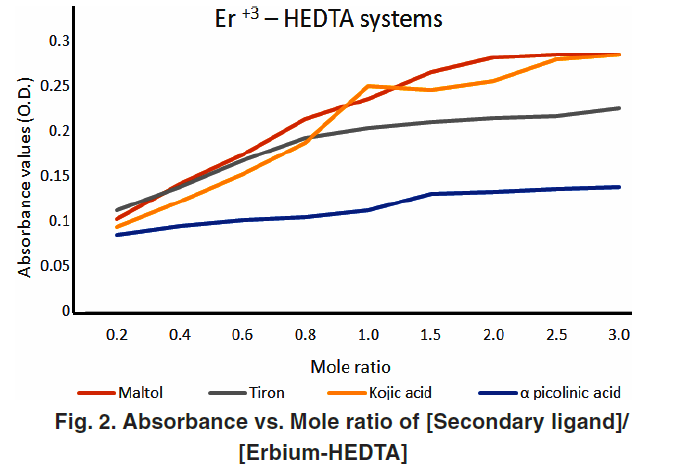
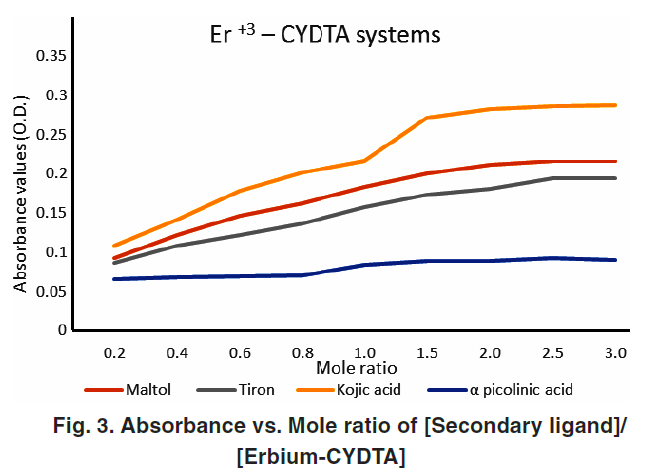
All studied systems showed a sharp break in absorbance plots at a 1:1 molar ratio, confirming that the ternary complexes formed have a 1:1:1 stoichiometry—Er³⁺:primary ligand:secondary ligand. This is consistent with other rare earth ternary systems previously reported.
Figures 1–4 (Absorbance vs Mole Ratio) confirmed complete transformation of the binary complex to ternary form at this ratio.


Spectral Characteristics and Hyperchromic Effect
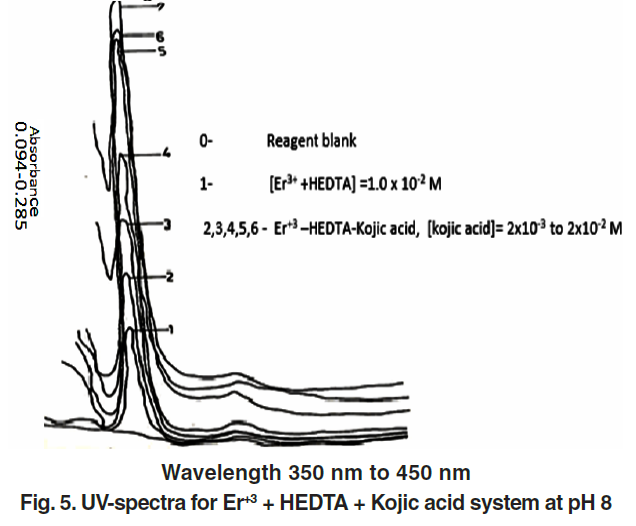
Ternary complexes exhibited a noticeable increase in absorbance compared to binary complexes—indicative of hyperchromic behavior. This is due to improved electronic transitions facilitated by coordination with the second ligand.
Figure 5 shows representative UV spectra for the Er³⁺–HEDTA–Kojic acid system.
Molar Extinction Coefficients
Table 1 summarizes the % increase in molar extinction coefficients (Em) of ternary complexes over binary ones for various ligand combinations.
| Secondary Ligand (SL) | % Increase in Em with EDTA (L·mol⁻¹·cm⁻¹) | % Increase in Em with HEDTA (L·mol⁻¹·cm⁻¹) | % Increase in Em with CYDTA (L·mol⁻¹·cm⁻¹) | % Increase in Em with EGTA (L·mol⁻¹·cm⁻¹) |
|---|---|---|---|---|
| Maltol | 83.2 | 79.1 | 69.9 | 31.52 |
| Tiron | 76.9 | 72.1 | 66.7 | 29.0 |
| Kojic Acid | 82.8 | 79.0 | 77.3 | 57.7 |
| α-Picolinic Acid | 47.0 | 56.6 | 27.7 | 10.44 |
Figure 6 illustrates the comparative hyperchromic effects across different ligand systems. Kojic acid produced the highest enhancement, followed by maltol, tiron, and α-picolinic acid.

Stability Constants and Affinity Parameters
Conditional stability constants (log Ks₁) and their corrections based on ligand basicity (pKₕ) were calculated. Corrected values reveal:
- Highest stability with α-picolinic acid in all systems
- Lower stability with maltol, attributed to lower basicity and coordination strength.
Table 2 presents both conditional and corrected stability constants.
| Secondary Ligand | Er³⁺–EDTA Log Ks₁ | Log Ks₁ / pKₕ | Er³⁺–HEDTA Log Ks₁ | Log Ks₁ / pKₕ | Er³⁺–CYDTA Log Ks₁ | Log Ks₁ / pKₕ | Er³⁺–EGTA Log Ks₁ | Log Ks₁ / pKₕ |
|---|---|---|---|---|---|---|---|---|
| Maltol | 2.55 | 0.29 | 3.37 | 0.38 | 3.27 | 0.37 | 3.02 | 0.35 |
| Tiron | 3.22 | 0.42 | 3.48 | 0.45 | 2.61 | 0.34 | 3.34 | 0.38 |
| Kojic Acid | 2.72 | 0.35 | 2.84 | 0.36 | 3.48 | 0.44 | 3.16 | 0.40 |
| α-Picolinic Acid | 2.86 | 0.57 | 3.06 | 0.60 | 2.52 | 0.50 | 2.89 | 0.57 |
Figure 7 plots the affinity parameter (log Ks₁/pKₕ), providing deeper insight into the relative ligand–metal interactions.
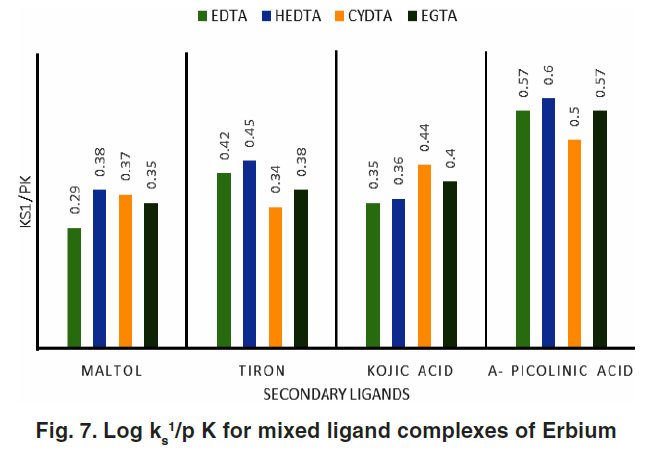
Order of Stability and Ligand Preference
- For EDTA and HEDTA systems:
α-Picolinic acid > Tiron > Kojic acid > Maltol - For CYDTA and EGTA systems:
α-Picolinic acid > Kojic acid > Tiron > Maltol
The greater affinity for nitrogen-donor ligands (like α-picolinic acid) over oxygen-donor ligands (like maltol) highlights erbium’s coordination preferences.
Conclusion
This study confirms the stoichiometry (1:1:1) and stability of ternary complexes formed between erbium and various ligand systems. The significant hyperchromic effect and enhanced molar absorptivity in ternary complexes provide a reliable spectrophotometric basis for erbium detection at trace levels.
Key outcomes:
- The ligand system influences both absorbance and stability.
- Kojic acid and α-picolinic acid yielded higher molar extinction coefficients.
- The affinity parameter offers a more accurate evaluation of ligand preference than raw stability constants.
These findings can facilitate the analytical detection and quantification of erbium and related rare earth elements.
Acknowledgment
The author expresses sincere thanks to faculty of Department of chemistry for their valuable guidance and support.
Conflicts of Interest
The author declares no conflicts of interest.
References
- Taketatsu, T.; Yoshida, S. J. Inorg. Nucl. Chem. 1973, 35, 881–890.
- Cam, T.; Irez, G.; Aydin, R. J. Chem. Eng. Data 2011, 56(5), 1813–1820.
- Shetty, S. Y.; Sathe, R. M. J. Talanta 1976, 23, 46–47.
- Khan, M. M. T.; Reddy, P. R. J. Inorg. Nucl. Chem. 1972, 34, 967–972.
- Vekhande, C.; Munshi, K. N. Indian J. Chem. 1976, 14, 189–191.
- Zade, B. A.; Kalbende, P. P.; Umerkar, S. M.; Belsare, W. G. J. Chem. 2012, 9(4), 2394–2406.
- Dhepe, S. A.; Zade, B. A. J. Chem. 2011, 8(3), 1264–1274.
- Shetty, S. Y.; Sathe, R. M. Indian J. Chem. 1983, 22A, 452–453.
- Vogel, A. I. Textbook of Quantitative Inorganic Analysis; 5th ed.; Longman: London, 1989; pp 328–352.
- Wang, X.-C.; Gao, Q. K.; Wang, K. J.; Wang, R. Chem. Papers 2012, 66, 188–193.
- Sathe, R. M.; Shetty, S. Y. Indian J. Chem. 1986, 25A, 494–495.
- Belsare, G. W.; Zade, A. B.; Kalbende, P. P.; Belsare, P. U. Der Pharma Chemica 2012, 4, 1226–1238.