
Introduction: Metal complexes containing azo linkages have gained significant attention over the past few decades.¹ These complexes exhibit a wide range of applications, including catalysis, pharmaceuticals, and molecular-based materials.²,³ Cyclic voltammetry studies of these complexes reveal their redox behavior, highlighting their potential catalytic applications, while their fluorescence properties suggest suitability for sensor applications.⁴⁻⁷
Unique asymmetric porphyrin ligands were coordinated with metals such as Cu²⁺, Fe³⁺, Mn³⁺, and Zn²⁺ to form new complexes, which displayed absorbance at higher wavelengths. Each ligand demonstrated fluorescence-based chemosensing capabilities for the detection of Hg²⁺ ions in solution. Additionally, the superoxide dismutase activity and electrochemical properties of the complexes were investigated.⁸ UV–Vis and emission spectral studies indicated that the ligands exhibited selective colorimetric responses toward Co²⁺ and Cu²⁺ cations, distinguishable from other metal ions.⁹
Schiff base chemosensors were designed to selectively bind metals such as Zn²⁺, Cd²⁺, and Hg²⁺, with their complexes displaying strong fluorescence.¹⁰ These Schiff base ligands serve as versatile tools in “switch on/switch off” fluorescence applications for the detection of various analytes.¹¹
In the present work, a theoretical study was conducted to analyze molecular structure, electrostatic potential, and Mulliken charges using density functional theory (DFT) with the B3LYP/6-31G(d,p) basis set. The molecular electrostatic potential, as well as the HOMO and LUMO energies, were calculated. The HOMO–LUMO energy gap indicates the extent of charge transfer within the molecule.
2. EXPERIMENTAL SECTION
2.1. CHEMICALS
Naphthol, sodium nitrite, 1,5-diaminonaphthalene and hydrochloric acid were received from Madras Scientific and Suppliers Pvt. Ltd. Tiruchirappalli, India.
2.2. MEASUREMENTS
The synthesized ligand was characterized by IR spectroscopy using a PerkinElmer Spectrum Two instrument (KBr pellets) in the range of 4000–400 cm⁻¹. ^1H and ^13C NMR spectra were recorded at 400 MHz at room temperature on a Bruker 400 MHz NMR spectrometer (Bruker BioSpin, California, USA). UV–Vis spectra were obtained with a PerkinElmer Lambda 35, and photoluminescence measurements were recorded using a PerkinElmer LS55 spectrometer. Lifetime measurements were carried out using a nanosecond time-correlated single-photon counting (TCSPC) spectrometer, Horiba Fluorocube-01-NL, with a NanoLED pulsed diode as the excitation source and a TBX-PS detector.
Cyclic voltammetry was performed with a CHI 604C electrochemical analyzer (USA) at a scan rate of 100 mV·s⁻¹. A 0.1 M solution of tetra-(n-butyl)ammonium hexafluorophosphate was used as the supporting electrolyte, with Ag/Ag⁺ (0.01 M AgNO₃) as the reference electrode and a platinum electrode as the working electrode. The system was standardized using the ferricenium/ferrocene redox couple.
2.3. COMPUTATIONAL DETAILS
The theoretical calculations analysis were using Gaussian 03 package.15 Computations of the perpendicular excitations, distinction density plots and optimization of the ground and excited states be perform by DFT using B3LYP/6-31G (d,p) set. The HOMO, LUMO frontier orbital’s of azo ligand were intended by DFT method at the B3LYP/ 6-31G (d,p) level.
2.4. SYNTHETIC ROUTE OF AZO LIGAND The azo ligand was synthesized using β-naphthol as a precursor, where sodium nitrite was condensed with 1,5-diaminonaphthalene in a 2:1 molar ratio. The resulting ligand was purified through column chromatography using a mixture of ethanol and chloroform. The purity of the synthesized ligand was confirmed by thin-layer chromatography (TLC). Azo ligands are well-known for their effectiveness as sensors for metal cations.¹⁶ Accordingly, the synthesized azo ligand (Scheme 1) was evaluated for its ability to detect various metal ions. The cations interact with the ligand through its nitrogen and hydroxyl groups, leading to the formation of a colored complex. This color change can be easily observed with the naked eye, providing a straightforward means of monitoring metal-ligand binding.

Scheme 1. Synthetic route of 2-((Z)-(5-((Z)-(3-hydroxynaphthalen-2-yl)diazenyl)naphthalen-1-yl)diazenyl)naphthalen-1-ol
3. RESULTS AND DISCUSSION
3.1. FT-IR, NMR AND MASS SPECTRAL
In FT-IR spectrum the hydroxyl (-OH) stretching frequency is 3435 cm-1 and N=N stretching frequency were scrutinized in the area of 1599 cm-1. The C-N and C-H stretching frequency were examined at 1211 and 1900 cm-1. Aromatic C=C stretching frequency at 3057 cm-1 were observed.

1H NMR and 13C NMR Analysis
The ¹H NMR spectrum of 2-((Z)-(5-((Z)-(3-hydroxynaphthalen-2-yl)diazenyl)naphthalen-1-yl)diazenyl)naphthalen-1-ol shows the aromatic proton signals as doublets at δ 7.61 (t, J = 8.0 Hz, 6H), 7.94 (dd, J = 8.8 Hz, 4H), 8.08 (dd, J = 9.0 Hz, 4H), 8.24 (d, J = 8.0 Hz, 2H), and 8.46 (d, J = 9.8 Hz, 4H), which correspond to H-8, H-33, H-34; H-30, H-31; H-9, H-35; H-32; and H-7 protons, respectively. A sharp singlet at δ 10.93 ppm confirms the presence of two hydroxyl (-OH) protons.
The ¹³C NMR spectrum of the ligand shows a signal at 151.30 ppm, assigned to nitrogen-substituted C-3 and C-10 carbons. Aromatic carbon signals appear in the range 115.08–151.30 ppm. Signals corresponding to hydroxyl-substituted C-27 and C-20 carbons are observed at 145.76 ppm. These spectral data confirm the presence of aromatic carbons, and the calculated molecular ion peak was observed at m/z 468.51.
3.2 Metal Ion Sensing via Colorimetry
The sensing ability of the ligand was evaluated in ethanol (1 × 10⁻² M) against metal ions Fe³⁺, Cr³⁺, Co²⁺, and Zn²⁺. Upon mixing the aqueous solutions of metal ions (1 × 10⁻² M) with the ligand solution, noticeable color changes were observed by the naked eye: the solution turned purple with Cr³⁺ and light brown with Fe³⁺, as shown in Figure 1. This indicates effective binding of these metal ions to the ligand, likely due to the high affinity of the azo moiety.
No significant color change was observed upon addition of Co²⁺ or Zn²⁺, suggesting that the ligand selectively senses Fe³⁺ and Cr³⁺. Importantly, each metal ion produced a distinct color change, allowing for visual differentiation between Fe³⁺ and Cr³⁺ ions.

Figure 1. Color change of ligand (1×10⁻² M in ethanol) addition of the ions like Cr3+, Co2+, Zn2+, Fe3+ (1×10⁻² M solution in H2O)
3.3. UV–VISIBLE SPECTRA AT DIFFERENT CONCENTRATION
UV–Visible spectrum of ligand with addition of metal ions Fe3+, Cr3+, Co2+ and Zn2+ is exposed in Figure 2, respectively. It capable of that growing the concentration of the metal ions that were added to ligand resulted in improved and decreased absorbance strength. Therefore, our ligand can be engaged to distinguish metal ions like Cr3+, and Fe3+ at 10-3 M.
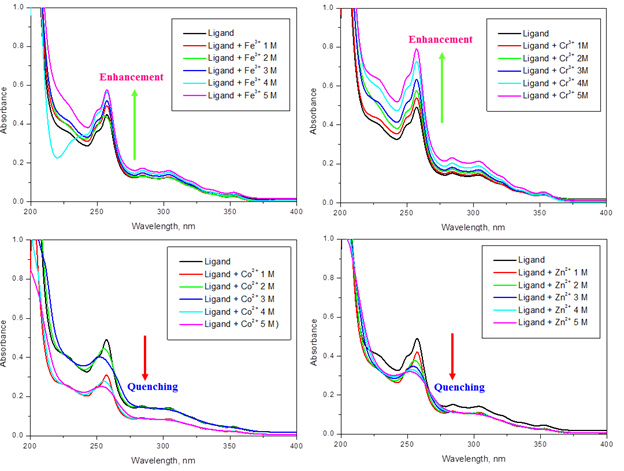
Figure 2. UV–Vis absorption spectrum of ligand (1×10⁻³ M) with various concentrations of Fe3+, Cr3+, Co2+ and Zn2+ ions in ethanol solutions.
3.4. EMISSION SPECTRA
The emission spectra of ligand with different concentration of metal ions are revealed in Figure 3. The emission peaks are noticed to be in the array of 322-329 nm. Quenching of fluorescence was observed in the Co2+ and Zn2+ metal ions. This quenching may lead to the chemosensor utility of the Schiff base. The enhancement spectra was observed at Fe3+and Cr3+ metal ions.
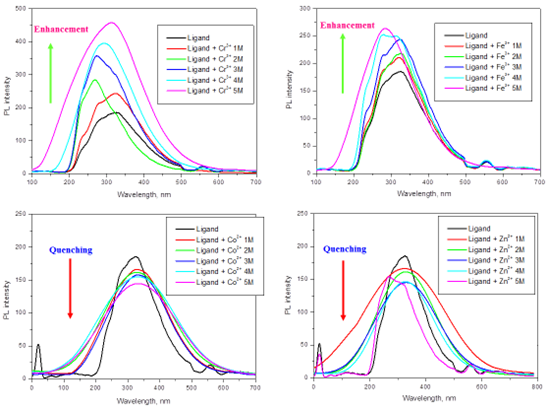
Figure 3. Photoluminescencespectrum of ligand (1×10⁻⁵ M) with various concentrations of Cr3+, Fe3+, Co2+ and Zn2+ ions in ethanol solutions
3.5 Electrochemical Analysis (CV)
Cyclic voltammetry (CV) was performed to evaluate the binding interactions of the ligand with Fe³⁺, Cr³⁺, Co²⁺, and Zn²⁺ ions. Figure 4 illustrates the cyclic voltammograms of the free ligand and its metal complexes. In the presence of Fe³⁺, Cr³⁺, Co²⁺, and Zn²⁺ ions, the ligand’s CV exhibits shifts in peak potentials along with a reduction in peak current. This behavior indicates strong binding interactions between the ligand and the metal ions, which is consistent with the observations from electronic spectral analysis.
3.6 Lifetime Decay
The emission lifetime decay of the ligand and its metal complexes follows biexponential kinetics, as shown in Figure 5. This confirms the interaction between the azo ligand and the metal ions. The measured emission lifetimes (τ) provide insight into the binding behavior of the ligand with different metal ions. The corresponding radiative (k_r) and non-radiative (k_nr) rate constants are summarized in Table 1.
The radiative efficiency of the metal complexes is higher than that of the free ligand, indicating enhanced electronic interactions. Lifetime analysis suggests that electron transfer occurs from the excited ligand to the ligand-metal complex. The rate constant for electron transfer (k_et) can be calculated using the equation:

(Table 1). The effective binding of metal ions to the ligand can be attributed to the extended surface curvature of the azo ligand, which minimizes steric hindrance and provides a larger number of unsaturated binding sites. These structural features facilitate strong interactions with the metal ions, highlighting the importance of investigating ligand-metal binding behavior.
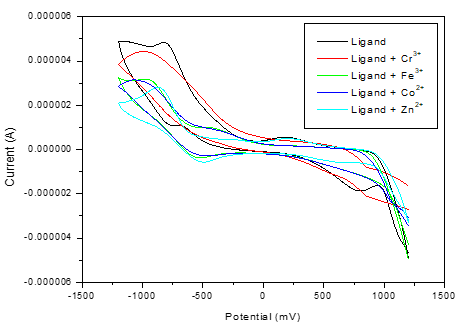
Figure 4. Cyclic voltammogram of Ligand with various Fe3+,Cr3+, Co2+ and Zn2+ metal ions

Figure 5. Life timespectra ofligand and ligand with metal ions
Table 1. Lifetime decay of azo ligand and ligand with metal ions
| Ligand+metal | τave (ns) | kr | knr | ket | K | n |
| Ligand | 1.17 | 0.35 | 0.54 | – | – | – |
| Ligand + Fe3+ | 3.95 | 0.14 | 0.11 | 0.05 | 5.18×10³ | 0.96 |
| Ligand + Cr3+ | 5.79 | 0.10 | 0.07 | 0.06 | 6.09×10⁴ | 0.98 |
| Ligand + Co2+ | 4.19 | 0.13 | 0.10 | 0.05 | 3.08×10⁹ | 0.96 |
| Ligand + Zn2+ | 3.98 | 0.12 | 0.09 | 0.06 | 3.08×10³ | 0.97 |
3.7. FRONTIER MOLECULAR ORBITAL
The electron density of FMO for (Figure 6) of 2-((Z)-(5-((Z)-(3-hydroxynaphthalen-2-yl)diazenyl)naphthalen-1-yl)diazenyl)naphthalen-1-ol contributed the entire molecule except the corresponding energy was tabulated (Table 2). HOMO molecular orbital picture of corresponding molecule illustrate that the bonding nature is additional in the aryl ring while anti-bonding nature is additional in the LUMO.
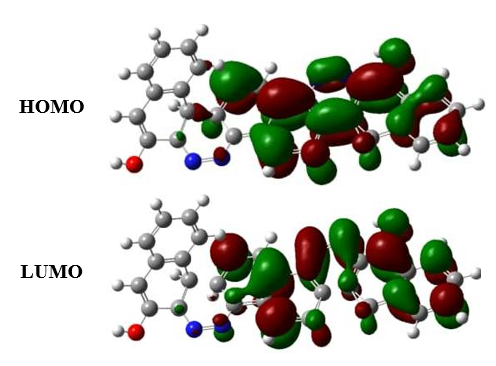
Figure 6. HOMO-LUMO orbital picture of 2-((Z)-(5-((Z)-(3-hydroxynaphthalen-2-yl)diazenyl)naphthalen-1-yl)diazenyl)naphthalen-1-ol
Table 2. Frontier molecular orbital values of ligand
| HOMO (eV) | LUMO (eV) | Eg values |
| -3.9266 | -2.2503 | -1.6763 |
- MEP – MOLECULAR ELECTROSTATIC POTENTIAL
The electrostatic potential for 2-((Z)-(5-((Z)-(3-hydroxynaphthalen-2-yl)diazenyl) naphthalen-1-yl)diazenyl)naphthalen-1-ol. The MEP (Figure 7) map obviously suggest that nitrogen and oxygen atoms stand for the negative region (dark red) but the nitrogen atom seem to use moderately tiny negative potential as compared to oxygen. The hydrogen atoms stand for maximum impact of positive charge (blue region). The majority of green area in the MEP surfaces corresponds to a potential intermediate between the two extremes red and dark blue. From a nearer assessment of various plots, one can simply conclude how the switch the hydrogen atom by substituents modifies the photophysical properties of ligand.

Figure 7. MEPpicture of 2-((Z)-(5-((Z)-(3-hydroxynaphthalen-2-yl)diazenyl)naphthalen-1-yl)diazenyl)naphthalen-1-ol
yl)diazenyl)naphthalen-1-ol
3.9. MULLIKEN CHARGE ANALYSIS
Mulliken18 populations give the simplest representation of the charge distribution. Charge mass purpose can lead to various significant properties of the molecule such as the charges on the different atoms (Figure 8). The Mulliken charges for the without hydrogen atoms of the ligand were calculated at B3LYP/6-31G (d,P) set. The atomic charges illustrate the nitrogen, oxygen atoms contain better negative atomic charges compared to carbon. This performance can be the outcome of intramolecular N − HO hydrogen bond and double bond features (Table 3).

Figure 8. Mulliken charge allotment of 2-((Z)-(5-((Z)-(3-hydroxynaphthalen-2-yl)diazenyl)naphthalen-1-yl)diazenyl)naphthalen-1-ol
Table 3. Mulliken Charges (q) in the non-hydrogen atoms of ligand calculated with B3LYP/6-31G (d,P) set
| S. No. | Atoms | DFT (q) | S. No. | Atoms | DFT (q) |
| 1 | C | -0.250541 | 19 | C | 0.046637 |
| 2 | C | 0.147233 | 20 | C | 0.251219 |
| 3 | C | -0.013170 | 21 | C | -0.113270 |
| 4 | C | 0.045891 | 22 | C | -0.088775 |
| 5 | C | 0.092451 | 23 | C | -0.107251 |
| 6 | C | -0.251317 | 24 | C | -0.081777 |
| 7 | C | -0.163936 | 25 | O | -0.569760 |
| 8 | C | -0.173149 | 26 | C | 0.044689 |
| 9 | C | 0.309641 | 27 | C | -0.116149 |
| 10 | C | 0.067113 | 28 | C | -0.054328 |
| 11 | N | -0.296158 | 29 | C | 0.123168 |
| 12 | N | -0.309188 | 30 | C | 0.358482 |
| 13 | N | -0.380820 | 31 | C | -0.201604 |
| 14 | N | -0.306994 | 32 | C | -0.118190 |
| 15 | C | 0.186275 | 33 | C | -0.074004 |
| 16 | C | -0.031182 | 34 | C | -0.176724 |
| 17 | C | -0.335644 | 35 | C | 0.017744 |
| 18 | C | 0.106135 | 36 | O | -0.554052 |
4. CONCLUSIONS
- The synthesized ligand, 2-((Z)-(5-((Z)-(3-hydroxynaphthalen-2-yl)diazenyl)naphthalen-1-yl)diazenyl)naphthalen-1-ol, was developed and employed for the detection of various metal ions in solution. The ligand demonstrated remarkable selectivity and sensitivity toward several metal cations, including Fe³⁺, Cr³⁺, Co²⁺, and Zn²⁺. UV–Visible spectroscopy revealed a prominent absorption peak at 257 nm, accompanied by a visible color change detectable by the naked eye. Photoluminescence, electrochemical studies, and lifetime decay analyses were used as direct approaches to monitor the ligand–metal interactions. Additionally, DFT calculations were successfully performed to investigate and support the electronic and structural properties of the synthesized ligand.
REFERENCES
- P. Pattanayak, P.; Parua, S.P.; Patra, D.; Pratihar, J.L.; Brandão, P.; Felix, V.; Chattopadhyay, S. Polyhedron. 2014, 74, 1.
- Mitra, K.; Patil, S.; Kondaiah, P.; Chakravarty, A.R. Inorg. Chem. 2015, 54, 253.
- Paul, N.D.; Samanta, S.; Mondal, T.K.; Goswami, S. Inorg. Chem. 2011, 50, 7886.
- Vishwakarma, P.K.; Mir, J.M.; Maurya, R.M. J. Chem. Sci. 2016, 128, 511.
- Decortes, A.; Castilla, A.M.; Kleij, A.W. Angew. Chem. Int. Ed. 2010, 49, 9822.
- Maurya, R.C.; Mir, J.M. Int. J. Sci. Eng. Res. 2014, 5, 305.
- Che, C.M.; Kwok, C.C.; Lai, S.W.; Rausch, A.F.; Finkenzeller, W.J.; Zhu, N.; Yersin, H. Chem. Eur. J. 2010, 16, 233.
- Gungor, S.A.; Kose, M.; Tumer, F.; Tumer, M. Dyes. Pig. 2016, 130, 37.
- Gurusamy, S.; Krishnaveni, K.; Sankarganesh, M.; Sathish, V.; Thanasekaran, P.; Mathavan, A. J. Mole. Liq. 2021, 325, 115190.
- Inal, E.K. J. Fluoresc. 2020, 30, 891.
- Berhanu, A.L.; Gaurav,; Mohiuddin, I.; Malik, A.K.; Aulakh, J.S.; Kumar, V.; Kim, K.H. Trends Anal. Chem. 2019, 116, 74.
- Jayabharathi, J.; Thanikachalam, V.; Saravanan, K. J. Photochem. Photobiol. A. 2009, 208, 13.
- Jayabharathi, J.; Thanikachalam, V.; Venkatesh Perumal, M.; Srinivasan, N. Spectrochim. Acta, Part A. 2011, 79, 236.
- Okada, S.; Okinaka, K.; Iwawaki, H.; Furugori, M.; Hashimoto, M.; Mukaide, T.; Kamatani, J.; Igawa, S.; Tsuboyama, A.; Takiguchi, T.; Ueno, K. Dalton Trans. 2005, 9, 1583.
- Frisch, M.J.; Trucks, G.W.; Schlegel, H.B.; Scuseria, G.E.; Robb, M.A.; Cheeseman, J.R.; Montgomery, Jr, J.A.; Vreven, T.; Kudin, K.N.; Burant, J.C.; Millam, J.M.; Iyengar, S.S.; Tomasi, J.; Barone, V.; Mennucci, B.; Cossi, M.; Scalmani, G.; Rega, N.; Petersson, G.A.; Nakatsuji, H.; Hada, M.; Ehara, M.; Toyota, K.; Fukuda, R.; Hasegawa, J.; Ishida, M.; Nakajima, T.; Honda, Y.; Kitao, O.; Nakai, H.; Klene, M.; Li, X.; Knox, J.E.; Hratchian, H.P.; Cross, J.B.; Bakken, V.; Adamo, C.; Jaramillo, J.; Gomperts, R.; Stratmann, R.E.; Yazyev, O.; Austin, A.J.; Cammi, R.; Pomelli, C.; Ochterski, J.W.; Ayala, P.Y.; Morokuma, K.; Voth, G.A.; Salvador, P.; Dannenberg, J.J.; Zakrzewski, V.G.; Dapprich, S.; Daniels, A.D.; Strain, M.C. Farkas, O.; Malick, D.K.; Rabuck, A.D.; Raghavachari, K.; Foresman, J.B.; Ortiz, J.V.; Cui, Q.; Baboul, A.G.; Clifford, S.; Cioslowski, J.; Stefanov, B.B.; Liu, G.; Liashenko, A.; Piskorz, P.; Komaromi, I.; Martin, R.L.; Fox, D.J.; Keith, T.; Al-Laham, M.A.; Peng, C.Y.; Nanayakkara, A.; Challacombe, M.; Gill, P.M.W.; Johnson, B.; Chen, W.; Wong, M.W.; Gonzalez, C.; Pople, J.A. Gaussian 03 (Revision E.01), Gaussian, Inc., Wallingford, CT, 2004.
- Singh, K.; Barwa, M.S.; Tyagi, P. Eur. J. Med. Chem. 2006, 41, 147.
- Wang, X.; Zhang, R.; Wu, C.; Dai, Y.; Song, M.; Gutmann, S.; Gao, F.; Lv, G.; Li, J.; Li, X.; Guan, Z.; Fu, D.; Chen, B. J. Biomed. Mater. Res A. 2007, 80A, 852.
- Mulliken, R.S. J. Chem. Phys. 1955, 23(10), 1833.