
Introduction: Currently, one of the primary causes of death globally is infectious diseases. As living standards have increased, consequently has the incidence of cancer, which is now the biggest hazard to human health [1], [2]. At the moment, one of the biggest challenges facing scientists is creating novel drugs to treat the great majority of illnesses.[3]. To manage these disorders heterocycles are crucial constituents of numerous natural materials and hold great significance in the field of organic chemistry[4],[5],[6]. Although traditional treatments like radiation and surgery are incredibly effective in treating some cancers, they still have limited success in curing aggressive tumours. Chemotherapy, a cornerstone of multidisciplinary cancer care, is substantially compromised by the significant toxicities of many anticancer drugs, which negatively impacts patients’ quality of life[7]. Thus, it is now essential for medicinal chemists to design anticancer medications with excellent selectivity and minimal toxicity. Because of the structural stiffness that their diverse spatial conformations bestow, several heterocycles have distinctive anticancer actions that are mediated by specialised binding to cancer targets[8]. Nitrogen-containing heterocyclic compounds are considered the most prevalent class of chemical substances, encompassing biologically active complexes and molecules widely utilized in medicinal chemistry.[9],[10]. Pyranopyrazole moieties are a significant class of heterocyclic compounds that includes both natural and manufactured molecules. They are composed of oxygen and nitrogen ring fused heterocycles, and among them, they have demonstrated exceptional biochemical behaviors and activities, providing a flexible framework for the development of novel drugs [11]. They have been integrated as fundamental components of diverse pharmacologically effective scaffolds [12],[13],[14]. Pyranopyrazoles’ well-known antibacterial properties[15], antimicrobial, anticancer[16], anti-inflammatory, analgesic[17], antidiabetic and cholinesterase-inhibiting as well as for how well they work to treat Alzheimer’s[18],[19], [20]. Additionally, they function as possible inhibitors of human Chk1 kinase[21]. As a result, a number of economical synthetic procedures that employ less expensive substrates, reusable catalysts, and environmentally acceptable solvents to synthesize pyranopyrazole derivatives have been produced. Asif et al. revealed a few new spirooxindole-pyranopyrazole compounds and assessed the National Cancer Institute’s (NCI), 60 cell lines for human cancer were tested for in vitro anticancer activity [22]. The compounds caused a 43.19% reduction in proliferaion in the lung cancer cell line HOP92 and a maximum development suppression of 82% in the colon cancer cell line KM12 at 10 µM [22]. Saleh et al. manufactured new pyrazolopyranopyrimidine compounds used an MTT assay to evaluate their anticancer effects against MCF7 breast cancer cells [23]. The most cytotoxic compounds were those with barbituric acid and hydroxyl groups, particularly those with the hydroxyl group at the benzene ring’s 4-position. The compounds showed the greatest inhibition capacity against MCF7, with an IC50 value of 145 µM/mL.
In addition to synthesis and characterization, understanding a compound is essential because of the connection between its structure and function. Various biological targets and pyranopyrazole compounds are investigated for possible interactions using molecular docking experiments. Docking analysis was employed to deeper comprehend ways of inhibition and manner of connections. [24]. It is employed to forecast how small compounds will interact to a protein target’s binding site [25]. This approach is particularly effective in determining the three-dimensional structure of the molecule. To create more specific and effecient treatments, an extensive understanding of the molecular targets and their interactions with ligands is necessary [26]. This procedure imitates how a protein and a tiny chemical interact at the atomic level [27]. Predicting the ligand’s structure and determining out where it will fit in the binding sites a process called as pose as well as assessing the binding affinity are the two crucial processes in the docking process [28]. By using the docking process, binding properties of ligand receptor complex can be predicted which provides information about free energy, binding energy and complexes stability [29]. Docking requires a mechanism which renders the ligand accessible prior to molecular docking and a data bank which permits targeted searching in the appropriate PDB format. There are several software tools available to synthesise the ligand in PDB format, one of which is Discovery Studio. These tools classify ligands based on how likely they are to interact with specific target DNA. To determine the ideal conformation for a complex of tiny molecules, molecular docking employs a prepared sample of possible ligand conformations in a particular target region [30]. One of the main scientific fields that promotes the use of molecules in applications is density functional theory. DFT investigations extend the structures and characteristics of pyranopyrazole [31], [32],[33], [34],[35], [36]. It will undoubtedly help with biological research. To understand the reactivity of the compounds, DFT studies were conducted. Further investigations were carried out employing charge distribution FMO, NBO, and MEP in order to obtain precise information [37].
3.1 RESULTS AND DISCUSSION:
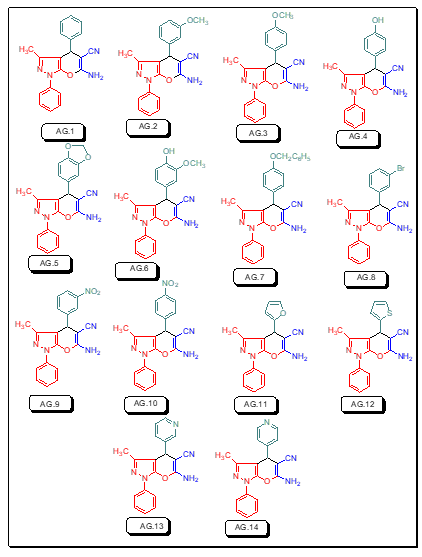
To examine how various electron donating and electron withdrawing features affect the dipole moments, HOMO-LUMO energy gaps, absorption wavelength and total hyperpolarizability, we have chosen fourteen compounds (AG.1–14) based on the pyrazoles moiety. It has been found that these fourteen compounds have exceptional binding capabilities with protein and DNA as well.
Figure 1: Structural fornulae of pyrano[2, 3-c]pyrazole derivatives (AG.1-14)
3.1 Quantum computational details
Gaussian 09 and DFT were used to optimize the compound’s molecular geometry compltely at B3LYP/6-311++G(d,p) level basis set. Additionally, ESP surface map, electrical characteristics, and global reactive discriptor investigations were all analyzed using the Multiwfn program.The PyMol application was used to develop the lower energy structure of the pyranopyrazole derivatives and save it as a PDB formatted document prior to molecular docking. Autodock tools conducted the docking procedure after obtaining the selected protein in PDB format from the website tool.
3.2. Molecular geometry
The optimal structure of the compound was found in the present work using 6-311++G(d,p)basis set and DFT ata B3LYP level. This ideal configuration has been discovered when smallest worldwide minimum energy is -2.6882 kcal/mol and dipole moment is 1.5384 Debye is depicted in Fig. 1. We identified two structurally comparable compounds whose properties in order to compare the bond length as well as bond angle theoretical values as a function of the compounds. Since heavier molecule attached at positions C11 and C12, which are thought to be weakest sites in this molecule, longest distance between bonds, 1.187 Å, calculated for CN-C17 &NH2-C18 based on optimized result. These results are in excellent accordance with those reported in the literature (1.787 & 1.807 Å). The range of CN-C CN-C bonds is normally 1.77-1.78 Å, however due of the difference in atoms’ electronegativity, It is far more extensive and the computed nearby C-C bonds (C10-C17 & C11-C18) are correspondingly shorter (1.531 Å). O3 and C19, This was dualistic in their dedication to them., were determined to have the most powerful bonds in molecule. As a result, the shortest distance for O3-H37 and O4-C19 are 0.97 and 1.207 Å, respectively, and these values are also in line with published values (1.006 & 1.228 Å). Furthermore , N5-C7, N5-C10, N5-C11, N6-C12, N6-H35 and N6-H36 are the significant calculated nitrogen attached bonds, with distances of 1.399, 1.455, 1.455, 1.463, 1.016 and 1.015 Å, respctively; the C-C bonds in the benzene ring are C9-C15, C9-C16, C13-C15, C14-C16, C7-C13 and C7-C14, with respective values of 1.398, 1.397, 1.39, 1.391, 1,41 and 1.409 Å. Bond angles of all derivatives are shown insupplimentary file (Table 1). There is no need for a lengthy description because the majority of which the bond angle variables are fairly similar to those that are commonly observed in structures with similar compound structures.The geometry optimisation of all derivatives is depicted in Figure 2.
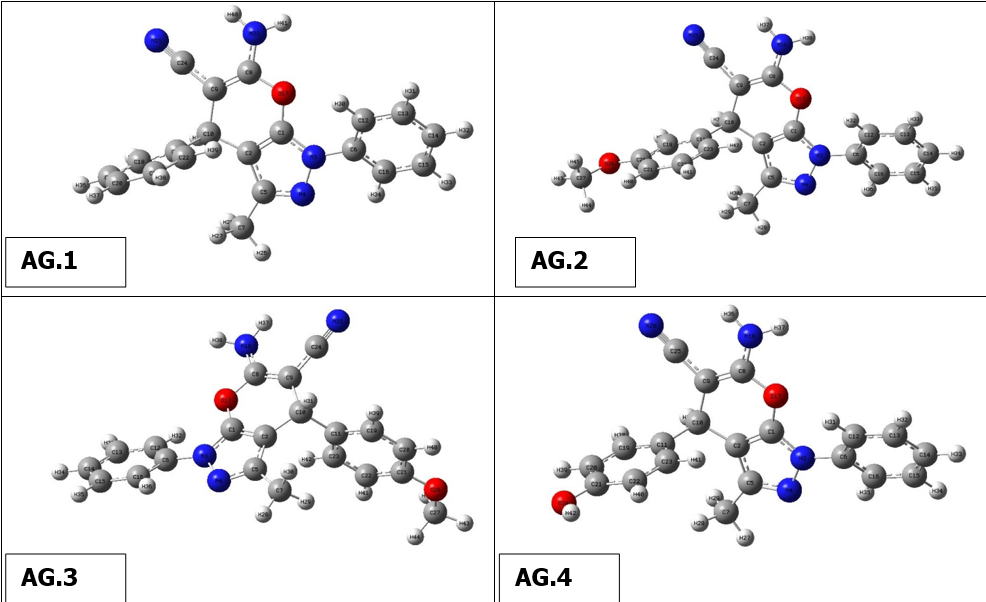
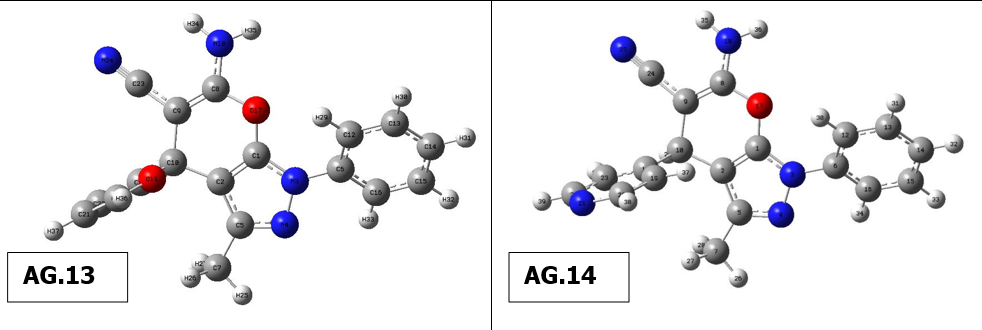
Figure 2 Geometry optimisation of molecules (AG.1-14)
3.3. FMOs analysis:
The energy values of orbitals that are filled and empty (HOMO & LUMO) can be utilized to comprehend the pharmacokinetics as well as stability of pyranazole molecule. High chemical excitability and a short FMO band gap characterize soft substances. To investigate derivatives of pyranazoles In this case, the effect of the solution was better explored. The spectral gap (ΔE) can be understood in Table 1.The band gap energies for various pyranazole derivatives are 3.7481, 3.79441, 4.9463, and 4.9420 eV.Nerrow band gap indicating that the moleculesare significantly more reactive.The lowest gaps are recorded for AG.14 and AG.13 at 3.7477eV and 3.7945eV, respectively, due to a noteworthy rise in EHOMO and decreasing ELUMO. For AG14 complex, the EHOMO, ELUMO, and EH-L values are -6.6351, -2.8877, and 3.7477 eV, while for AG13 complex, they are -6.6626, -2.8680, and 3.7945 eV. The largest gap is found for AG.1 complex. In the case of AG.2 complex, the EHOMO, ELUMO, and EH-L values are -6.3328, -1.2517, and 5.0810 eV. Minimal HOMO-LUMO gaps imply that the reactivity of these compounds might be increased.
Table 1: The EHOMO, ELUMO and EH-L all complexes in eV
| Complexes | EH (eV) | EL(eV) | EL – H (eV) |
| AG1 | -6.3309 | -1.8630 | 5.1445 |
| AG2 | -6.3328 | -1.2517 | 5.0810 |
| AG3 | -6.4413 | -1.3605 | 5.0800 |
| AG4 | -6.5222 | -1.4628 | 5.0594 |
| AG5 | -6.4343 | -1.3877 | 5.0466 |
| AG6 | -6.2982 | -1.2517 | 5.0464 |
| AG7 | -6.2383 | -1.2130 | 5.0246 |
| AG8 | -6.1815 | -1.1934 | 4.9570 |
| AG9 | -6.1622 | -1.2100 | 4.9521 |
| AG10 | -6.0715 | -1.1934 | 4.8780 |
| AG11 | -6.0800 | -1.2215 | 4.8584 |
| AG12 | -6.0024 | -1.2117 | 4.7906 |
| AG13 | -6.6626 | -2.8680 | 3.7945 |
| AG14 | -6.6351 | -2.8877 | 3.7477 |
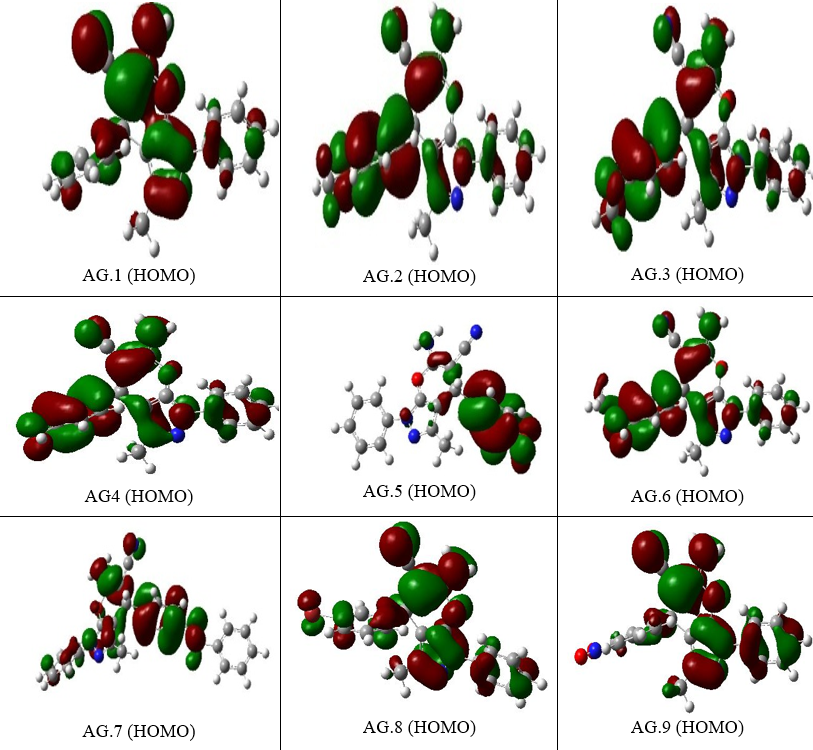
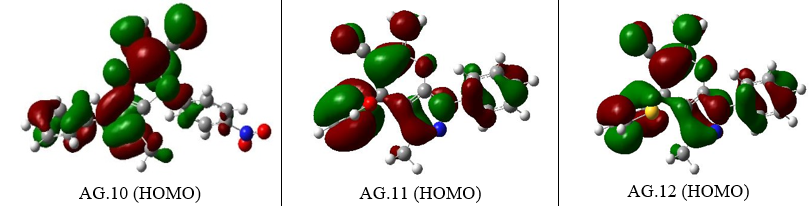
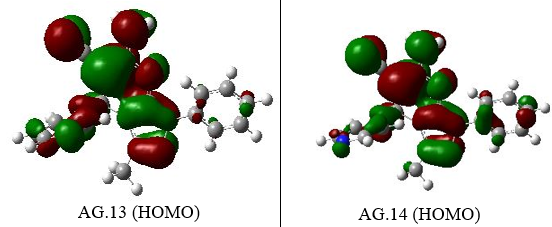
Figure 3. The EHOMO figures of all derivatives of Pyranopyrazole Scaffolds as active anti-breast cancer drug
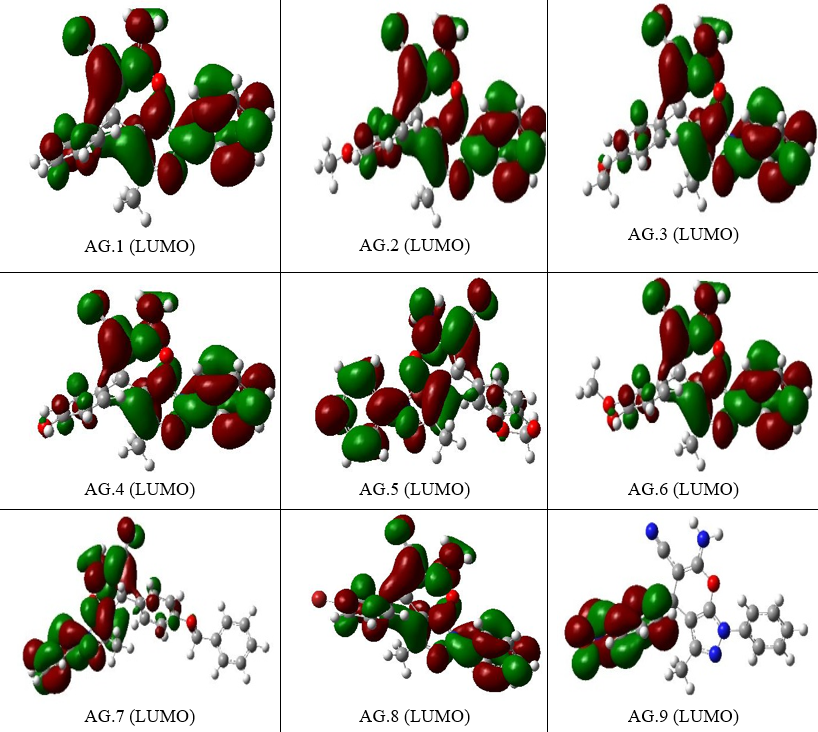
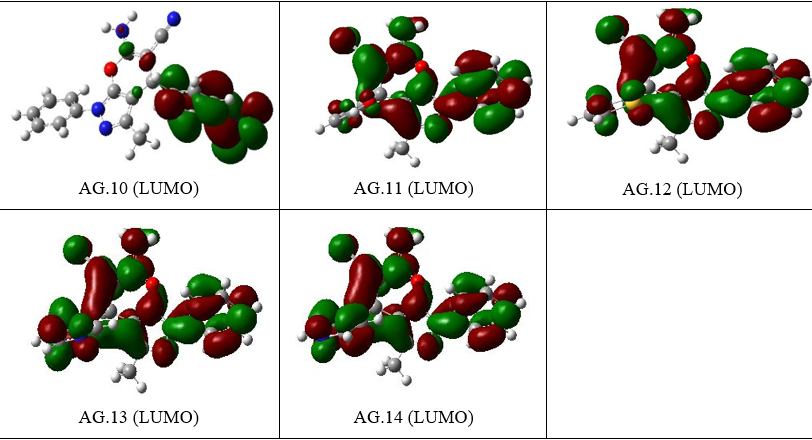
Figure 4.The ELUMO figures of all derivatives of Pyranopyrazole Scaffolds as active anti-breast cancer drug
3.4. MESP analysis and Reactivity Trends
The molecular electrostatic potential (MEP) surface analysis of the pyranopyrazole derivatives (Fig. 5) reveals distinct reactivity regions, correlating with the atomic charge distributions observed in AG1–AG14. The MEP minima (negative values, red regions) identify nucleophilic attack sites, with the most pronounced electrostatic potentials localized at NH₂ (−32.85 to −36.58 kcal/mol) and O4 (−19.12 to −35.62 kcal/mol), consistent with the high negative charges on nitrogen (N3/N25: −0.32 to −0.68 |e|) and oxygen (O17: ~−0.47 |e|) atoms in the atomic charge analysis. Conversely, MEP maxima (positive values, blue regions) highlight electrophilic attack sites, notably at CH₂ (C8-H20-H21) (+48.64 to +52.95 kcal/mol), aligning with the moderate positive charges on C8 (~0.44–0.53 |e|) in AG1–AG10. The exceptional polarization in AG11–AG14 (e.g., C11: −1.58 to −1.63 |e|) further rationalizes the intensified MEP minima near π-withdrawing groups, while AG5’s anomalous C7 charge (+0.82 |e|) underscores the impact of heterocyclic distortion on electrostatic potential. These results confirm that NH₂ and O2 serve as primary nucleophilic centers, whereas CH₂ moieties are key electrophilic targets, with charge delocalization in AG11–AG14 enhancing reactivity contrasts.
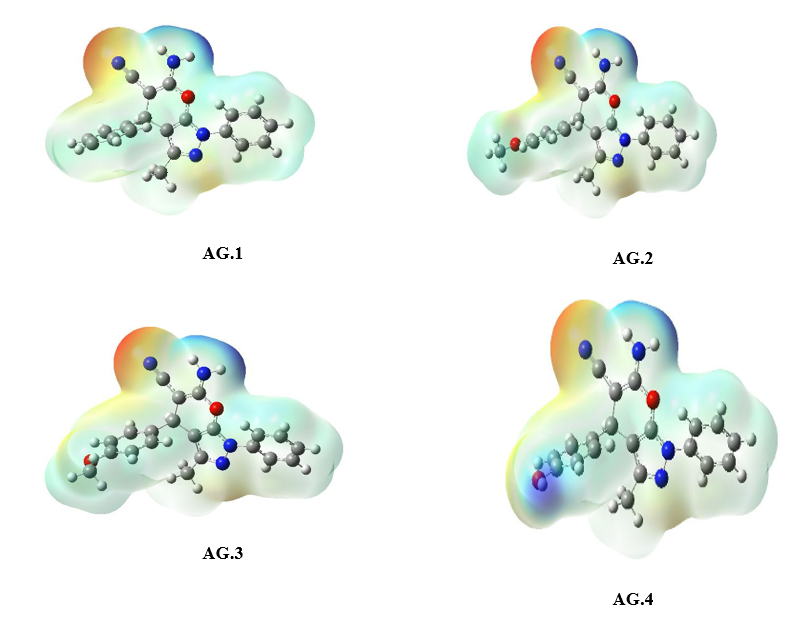
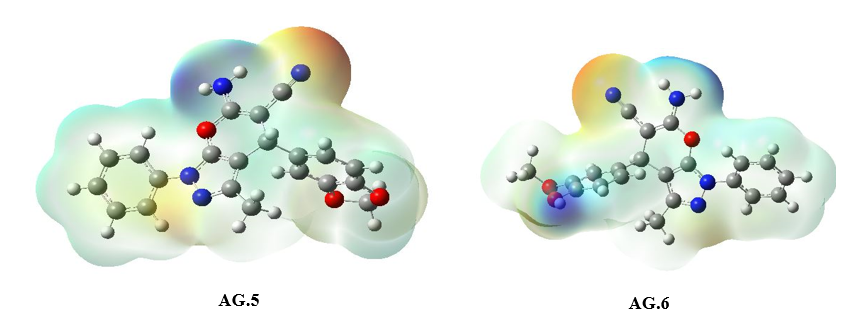
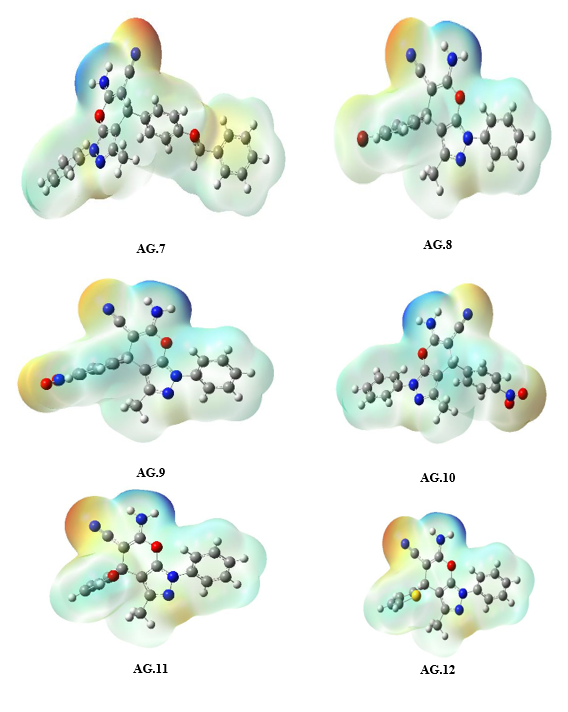
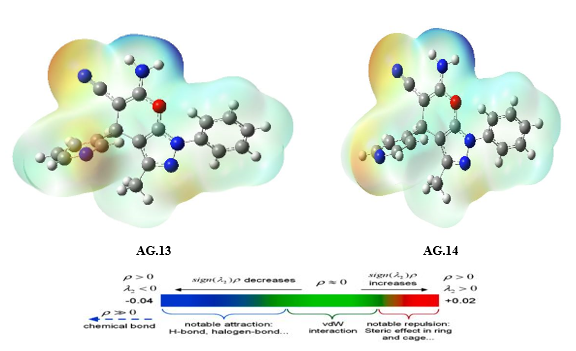
Figure 5: The MEP diagram of all derivatives of Pyranopyrazole Scaffolds as active anti-breast cancer drug
3.5. Electrostatic potential map
The Electrostatic Potential (ESP) is associated with electron density and offers valuable insights into the molecule’s reactivity, particularly toward electrophilic attacks. In Figure 5, ESP values are illustrated using a color gradient: red indicates the most electronegative regions, while blue signifies the most electropositive areas. The increasing order of potential follows the sequence: red < orange < yellow < green < blue. The ESP surface map was generated using the B3LYP/6-31++G basis set, based on the total electron density grid. The oxygen atom in the carbonyl group emerges as the most electrophilic site due to the significant electronegativity difference. The deep blue region highlights the most positively charged area, representing a favorable site for nucleophilic attack. These positive regions are primarily localized around the hydrogen atoms.
Red < orange < yellow < green < blue
3.6. Global reactivity descriptors
To evaluate the reactivity of these clusters, global reactivity descriptors including chemical hardness, chemical potential, and softness were calculated. Resistance to changes in the electronic distribution within clusters is used to quantify chemical hardness. Based on the information, the hardness value (2.55 eV) of the AG2, AG3, AG4, and AG5 cluster is the highest, while the AG13 & AG14 cluster has the lowest value. Table 3 demonstrates a positive link between decreasing values and larger sizes, indicating softness and reactivity. Comparably, the chemical softness (S) values rise from AG14 to AG01 and peak at 1.275 eV. Additionally, the chemical potential values are computed and provided in the table. The tendency of electrons in clusters to escape is indicated by greater chemical potential (μ) values. The stability of these clusters is indicated by the molecules that obtained significant values (negative).These numbers also imply that the clusters have a reasonable level of electrical stability and do not spontaneously break down into atoms. As statedby using Koopman’s theorem, negative energy of a LUMO is roughly equal to EA, while the negative energy of a HOMO is roughly identical to IP.The computation of other important factors like η, S, ω, and μ is done using the EHOMO and ELUMO. The following formulas to get the vertical electron affinity (EA) and vertical ionization potential (IP):
IP = − EHOMO(eV)
EA = − ELUMO(eV)
Similarly, electronegativity (ᵪ) chemical potential (μ), chemical hardness (η) electrophilicity index (ω) and chemical softness (s) are computed by equations
μ = − (IP + EA)/2
η = IP − EA/2
S = 1 /2η
Ω = μ 2 /2 η
Table 3: The Frontier Molecular Orbital (FMO) analysis involved the calculation of several parameters, including the highest occupied molecular orbital energy (EHOMO), lowest unoccupied molecular orbital energy (ELUMO), energy gap (ΔEg), ionization potential (IP), electron affinity (Ea), chemical hardness (η), chemical softness (S), electronegativity (χ), chemical potential (µ), and electrophilicity index (Ω). All values were expressed in electron volts (eV).
| Compounds | EHOMO (eV) | ELUMO (eV) | ΔE (eV) | IP (eV) | EA (eV) | ᵪ | µ | η | S | Ω |
| AG.1 | -6.33 | -1.86 | 5.14 | 6.3 | 1.8 | 4.05 | -4.05 | 2.25 | 1.125 | -3.64 |
| AG.2 | -6.32 | -1.25 | 5.08 | 6.3 | 1.2 | 3.75 | -3.75 | 2.55 | 1.275 | |
| AG.3 | -6.44 | -1.36 | 5.08 | 6.4 | 1.3 | 3.85 | -3.85 | 2.55 | 1.275 | |
| AG.4 | -6.52 | -1.46 | 5.05 | 6.5 | 1.4 | 3.95 | -3.95 | 2.55 | 1.275 | |
| AG.5 | -6.43 | -1.38 | 5.04 | 6.4 | 1.3 | 3.85 | -3.85 | 2.55 | 1.275 | |
| AG.6 | -6.29 | -1.25 | 5.04 | 6.2 | 1.2 | 3.70 | -3.70 | 2.50 | 1.250 | |
| AG.7 | -6.23 | -1.21 | 5.02 | 6.2 | 1.2 | 3.70 | -3.70 | 2.50 | 1.250 | |
| AG.8 | -6.18 | -1.19 | 4.95 | 6.1 | 1.1 | 3.60 | -3.60 | 2.50 | 1.250 | |
| AG.9 | -6.16 | -1.21 | 4.95 | 6.1 | 1.2 | 3.65 | -3.65 | 2.45 | 1.225 | |
| AG.10 | -6.07 | -1.19 | 4.87 | 6.0 | 1.1 | 3.55 | -3.55 | 2.45 | 1.225 | |
| AG.11 | -6.08 | -1.22 | 4.85 | 6.0 | 1.2 | 3.60 | -3.60 | 2.40 | 1.200 | |
| AG.12 | -6.00 | -1.21 | 4.79 | 6.0 | 1.2 | 3.6 | -3.6 | 2.40 | 1.200 | |
| AG.13 | -6.66 | -2.86 | 3.79 | 6.6 | 2.9 | 4.75 | -4.75 | 1.85 | 0.925 | |
| AG.14 | -6.63 | -2.88 | 3.74 | 6.6 | 2.9 | 4.75 | -4.75 | 1.85 | 0.925 |
3.7. Molecular Docking
A computer method called molecular docking estimates how well ligands will bind to proteins that serve as receptors. In recent years, molecular docking has become a vital tool in the in-silico drug design process. It involves predicting, at the atomic level, how a small molecule will interact with a target protein. For molecular docking strategies, a number of free and commercial computational tools and algorithms are obtainable [38].
By applying the AutoDock Vina program, the docking evaluation of pyranopyrazole derivatives (AG.1-14) was done. The protein data bank (PDB ID: IBNA) provided the crystal structures for each of proteins and DNA. By eradicating water molecules and introducing polar hydrogens, the DNA and proteins were altered for docking. DNA’s Kollman charges were computed. The gas phase pyranopyrazole deivatives (AG.1-14) were created for docking process by the optimization process. The Geistenger method was also used to figure out the molecule’s partial charges. The 40Å×40Å×40Å grid size was used to define the DNA and protein active sites. Through hydrogen bonding interactions, the pyranopyrazole derivatives (AG.1-14) attach to the active sites of proteins and DNA.
With DNA and the 3ert protein, each derivative of pyranopyrazole (AG.1-14) exhibits nine distinct postures with varying binding affinity values. The findings showed that the derivatives of AG.7 and AG.14 had the maximum binding affinity (∆G) when docking with DNA, at -8.2 and -8.0 kcal/mol. However, in case of protein, AG.7 derivatives exhibit the highest binding affinity. AG.7’s binding affinity (∆G) was measured at -8.6 kcal/mol.
Different visualizing docking pictures are given which shows binding or interactions of ligands AG.1-14 with 3ert and DNA. The molecular docking with 3ert and DNA is represented in Fig 4.10(a-d) and Fig 4.11(a-d) respectively.
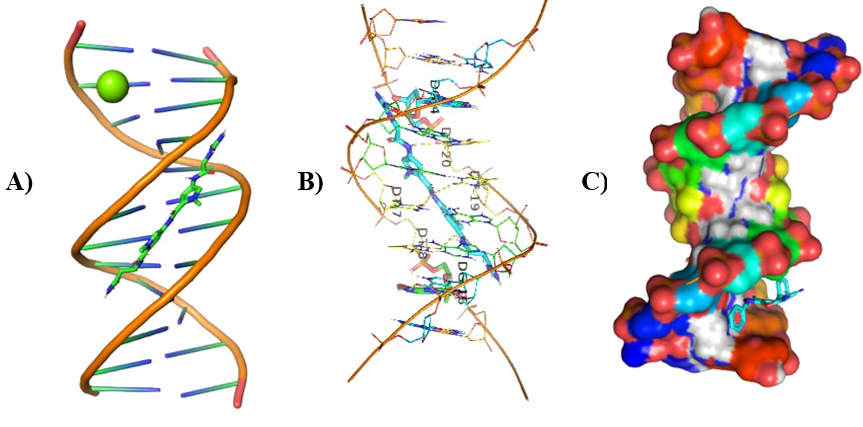
Figure 6: Molecular Docking of AG.1 with DNA.
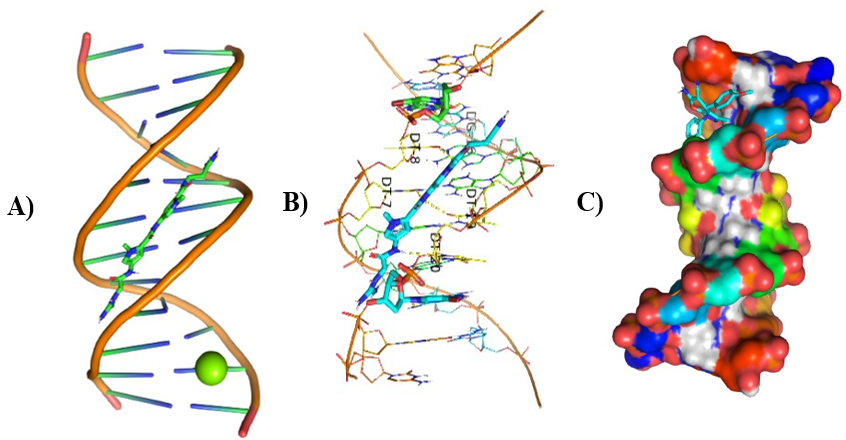
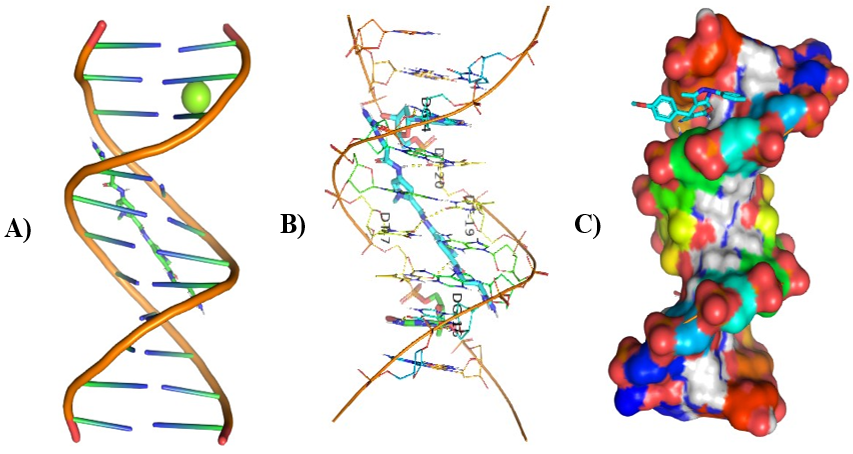
Figure 7: Molecular Docking of AG.2 and AG.3 with DNA
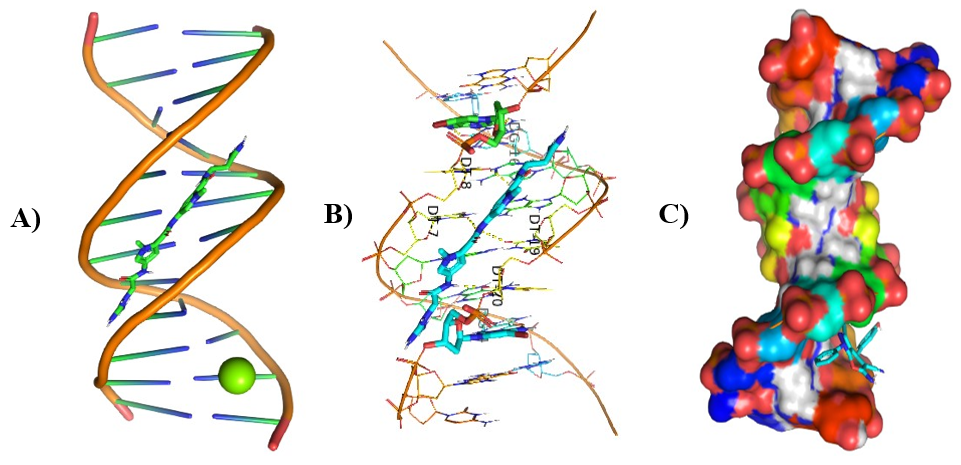
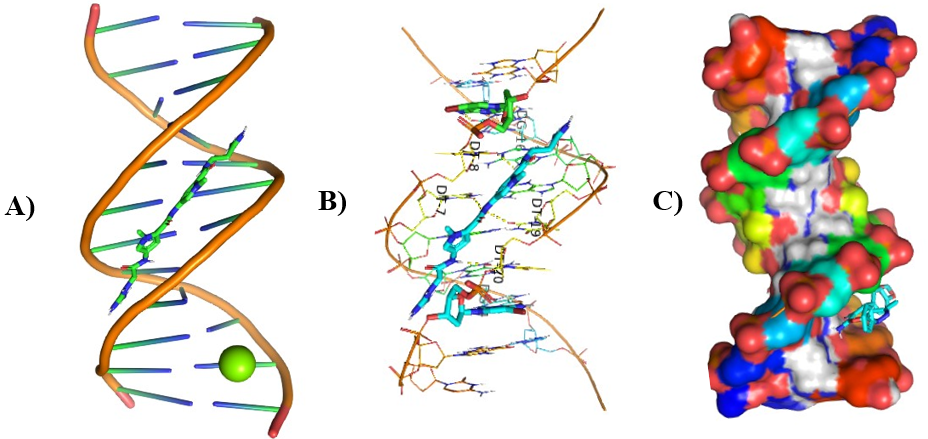
Figure 8: Molecular Docking of AG.4 and AG.5 with DNA.
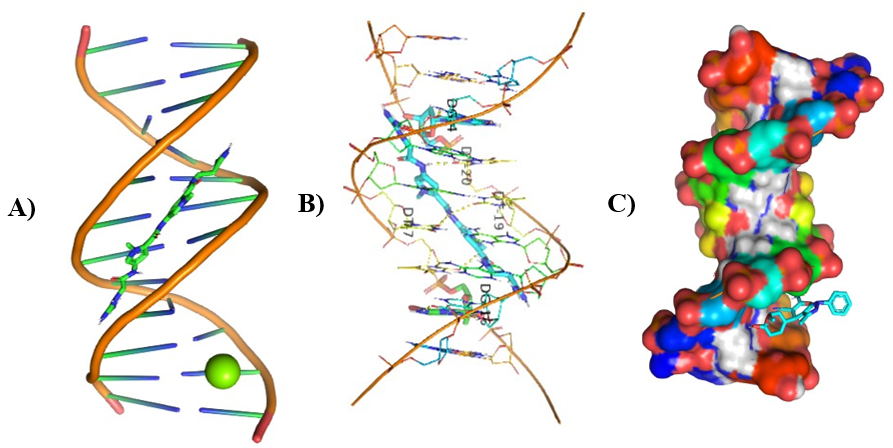
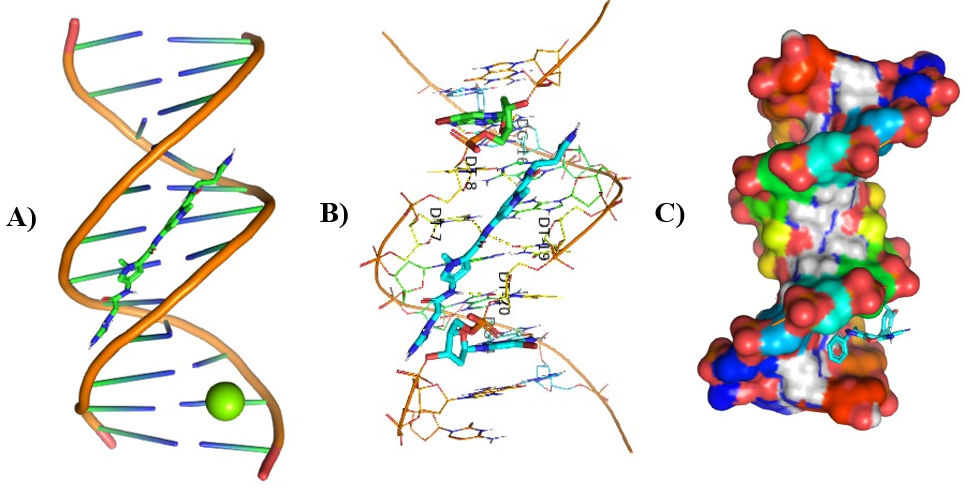
Figure 9: Molecular Docking of AG.6 and AG.7 with DNA.
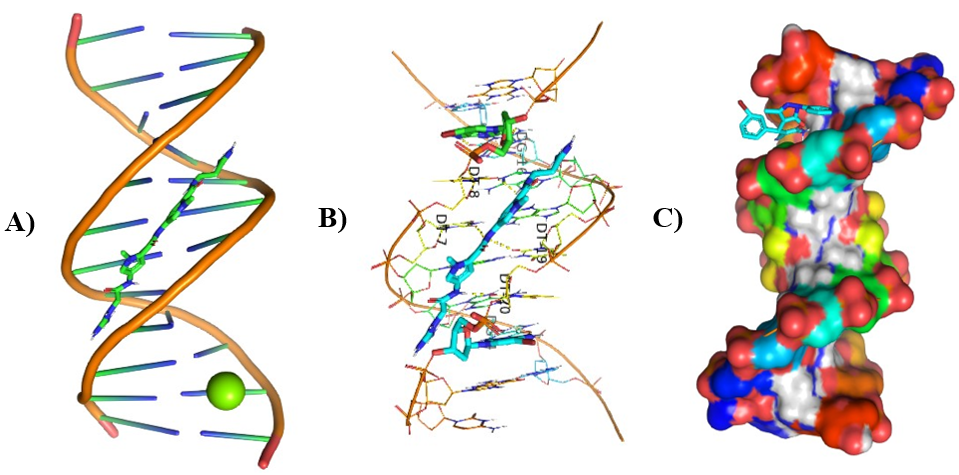
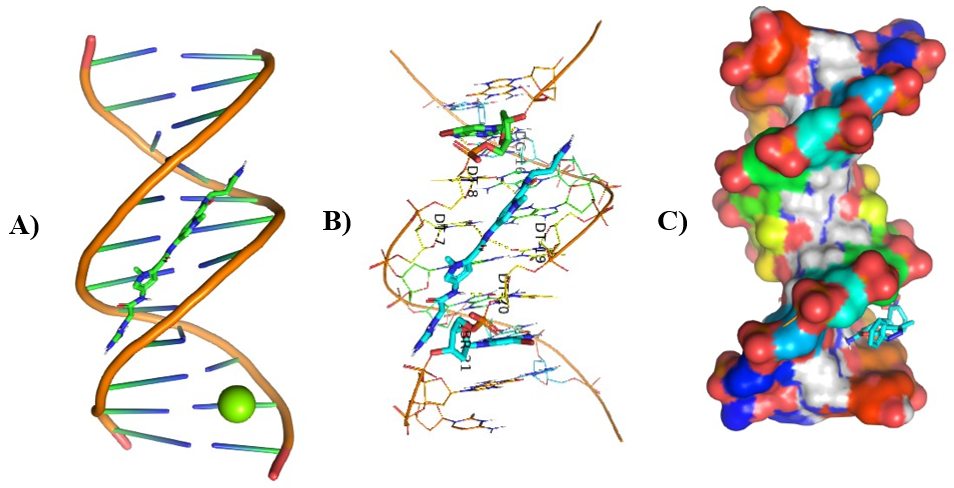
Figure 10: Molecular Docking of AG.8 and AG.9 with DNA.
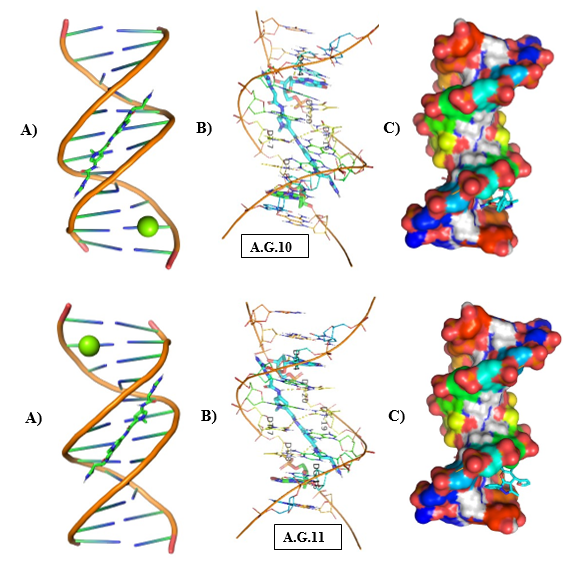
Figure 11: Molecular Docking of AG.10 and AG.11 with DNA.
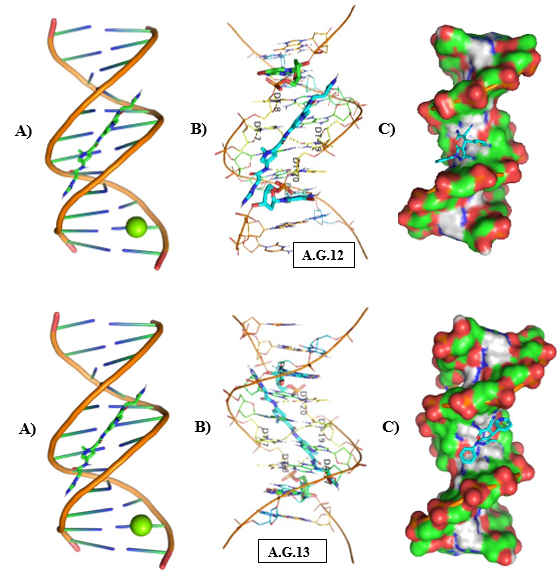
Figure 12: Molecular Docking of AG.12 and AG.13 with DNA.
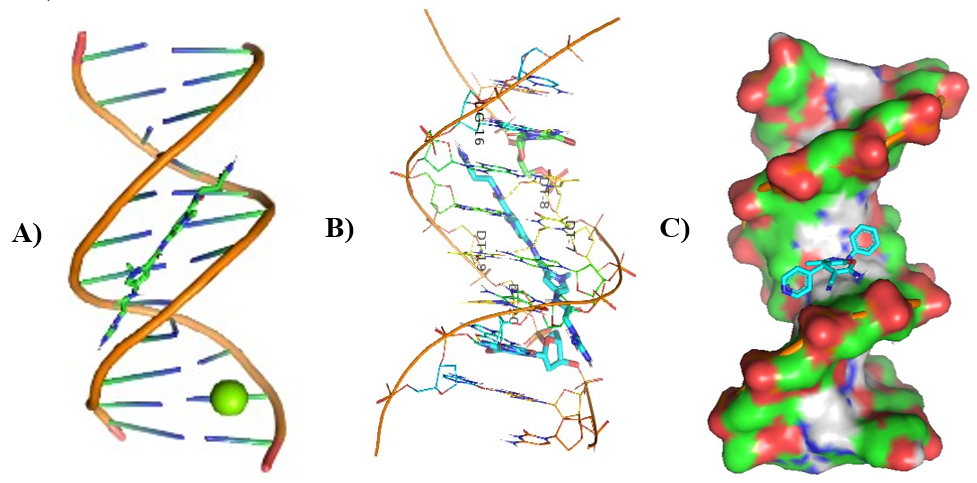
Figure 13: Molecular Docking of AG.14 with DNA.
In all abovefigures, (A) Docking of pyranopyrazole derivatives (AG.1-14) with DNA. (B) The detailed interaction of optimized structure of pyranopyrazole derivatives (AG.1-14) with DNA, the dotted lines show the interaction of pyranopyrazole derivatives (AG.1-14). (C) It is represented the ligand pose with DNA in solid phase. These dotted lines show hydrogen bonding of ligand compounds with DNA.
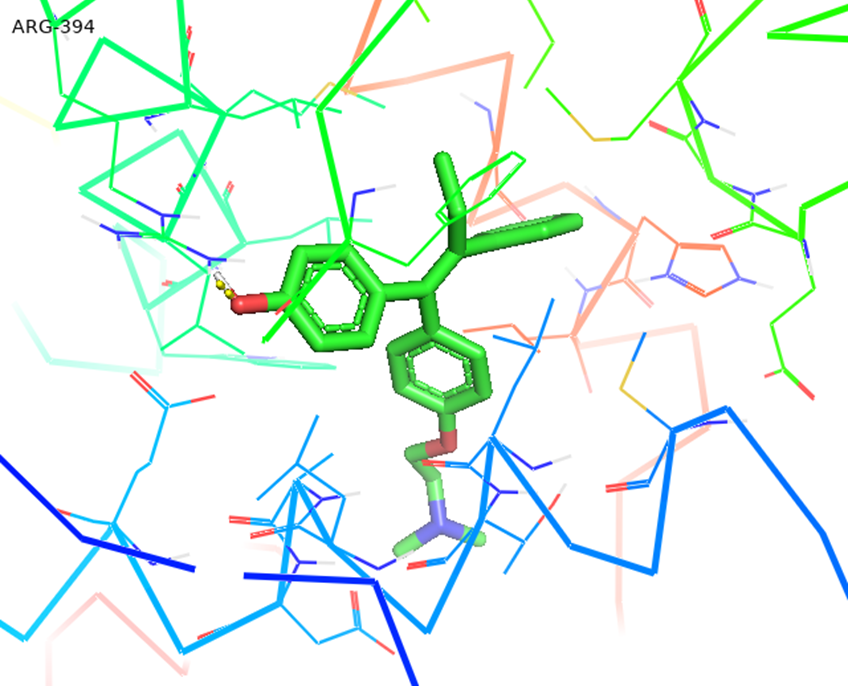
Figure 4.10d: Molecular Docking of AG.7 with 3ert.
4 CONCLUSION
Bond lengths and bond angles from geometric optimization using the B3LYP/6-31++G(d,p) basis sets were found to be in reasonable accordance with the published literature. B3LYP/6-31++G(d,p) shift was determined to be more consistent with the published results of experiments. The structure’s stability and H-bonding were demonstrated by the higher disturbance energy obtained from NBO analysis. A smaller HOMO-LUMO energy gap provided the proper orbital transition. AG.1-14 displayed a greater charge transfer. The ESP contour map demonstrated a robust charge transfer within the molecules, while global reactivity discreptor provided information on the molecule’s hardness and softness. Because of the arrangement of Mulliken charges, the title compound’s oxygen has a negative charge, making it an ideal site for electrophilic attack.
Molecular docking of these named compounds was done using 3ert protein and DNA at the final phase of this research. Each of the nine different pyranopyrazole derivatives shows different binding affinities with DNA and 3ert protein. The outcomes demonstrated the following order of binding affinities for derivatives designated as AG.1-14.
The increasing order of AG.1-AG.14 compounds in case of DNA as;
AG.7˂ AG.14˂ AG.5=AG.8= AG.10˂ AG.1= AG.9=AG.12= AG.13˂ AG.2= AG.3=˂ AG.4˂ AG.6˂AG.11
The increasing order of AG.1-AG.14 compounds in case of protein as;
AG.7˂ AG.5˂ AG.9˂ AG.3= AG.8˂ AG.1=AG.10˂ AG.2AG.4= AG.6=AG.13˂ AG.14˂ AG.11=AG.12
ACKNOWLEDGEMENTS
We thank Dr. Amin Abid from Department of Chemistry, University of Sahiwal, for helpful suggestions and complete assistance with preparing figures and manuscript outline.
Author Contributions
Abdul Ghafoor wrote the main manuscript Draft, writing, Muhammad Amir Abass and Javed Ali studied computational work, Amin Abid supervision, Manahal Abbasand Sadia Shabbirstudied Data validation and Rakia AliEditing , Reviewing. All authors reviewed the manuscript outline.
Funding
No Funding
Data Availability
No datasets were created or analyzed in the course of this study.
Competing Interests
There are no conflicts of interest exist among authors of this research paper.
Consent to participate
Not applicable.
Consent for publications
The article does not contain any material that is offensive, defamatory, or that would, in any way, violate the terms and conditions outlined in the agreement if published.
REFERENCES
1. Hulvat, M.C., Cancer incidence and trends. Surgical Clinics, 2020. 100(3): p. 469-481.
9. Panchal, N.B., et al., Acridine a versatile heterocyclic moiety as anticancer agent. 2020.