
Introduction
Photogalvanic Cells and Biphasic Liquid Crystal Systems
Photogalvanic cells work by generating high-energy products when a photon excites the system; these energy-rich products subsequently release their energy electrochemically in the form of electricity. A change in the concentration of the two forms of the redox couple enables the cell to develop a photovoltage. In this study, self-assembled lyotropic liquid crystals were employed to create biphasic photogalvanic cells (‘liquid crystal | liquid’). The aim was to design and optimize a series of photogalvanic cells to achieve maximum power conversion efficiency and to investigate the underlying mechanism of power generation within the cell. While photogalvanic processes and photochemistry are well-established fields, this study seeks to develop a novel system demonstrating how wastewater can be used as a low-cost, environmentally friendly medium for generating electricity.
Materials and Methods
Electrochemical Measurements:
Electrochemical experiments were conducted using an Autolab PGSTAT30 potentiostat. A three-electrode setup was employed in all cases, with a nickel wire spiral serving as the counter electrode and a silver/silver chloride electrode as the reference. The working electrode consisted of a 3.0 mm diameter glassy carbon disc (BASI, UK).
Reagents
All chemical reagents were purchased from Sigma-Aldrich.
Procedures
Formulation of Lyotropic Liquid Crystals:
Surfactant (Brij 35 or Triton X-100) and aqueous electrolyte (KCl) mixtures were prepared according to the mass ratios specified in published phase diagrams. The mixtures were homogenized with the required redox dopant and photosensitizer, N-methylphenothiazine (NMP), by heating to approximately 320 K with stirring for about one hour to form a micellar isotropic phase. The samples were then allowed to cool slowly to 294 ± 2 K.
System Under Investigation (Photo-Biphasic Batteries):
An indium tin oxide (ITO) cell was connected to a tube and half-filled with the NMP-containing liquid crystal, followed by the addition of aqueous ZnCl₂ solution on top, creating a biphasic system. A two-phase (liquid crystal | liquid) photogalvanic cell was thus constructed and tested. NMP was selected as the photoactive agent due to its structural similarity to thionine and because it had not previously been explored in photocells. Chloroform was used as a mediator, simulating an artificial pollutant for the study.
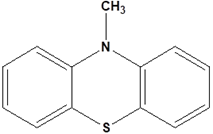
N-methylphenothiazine
Results and discussion
UV-Vis spectra of NMP in Lα phase and H1phase
The experimentally observed absorption for NMP maxima is π to π* peak at 352 nm (3.52 eV) in Lα 2.6628 and in H1 phase the absorbance is 2.2190 Figure 1. So it can be seen that the Lα phase observed higher absorbance than H1 . However, the energy band was calculated from the wavelength by using this formula12-14: Energy (E) = , where, Energy (E) = band gap, planks constant (h) = 6.626×10^34 Joules sec, velocity of light (C) = 2.99×10^8 meter/sec and wavelength (λ) = absorption peak value. Also 1eV = 1.6×10^-19 Joules (conversion factor).
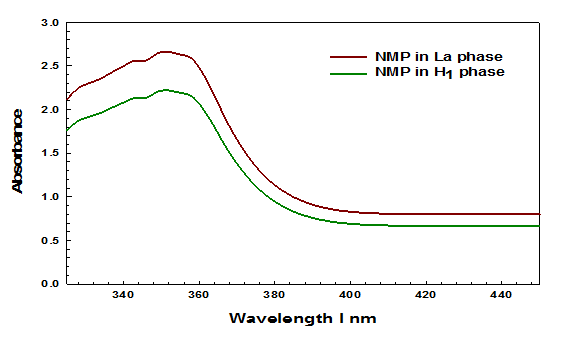
Figure 1 UV-Vis spectra of 0.1 M NMP in Lα phase and H1 phase.
Determination of NMP by differential pulse voltammetry(DPV)
The DPV15 exhibited anodic peak in about 0.523 V to the oxidation of NMP in Lα phase Figure 2 , also exhibited anodic peak in about 0.5532 V to the oxidation of NMP in H1 phase . Figure 3. Surfactant changes the potential peak NMP and therefore the charging current. The peak potential at Lα phase has lower than at H1 phase. The height of the current wave of NMP in Lα phase was found to be higher than in H1 phase. Therefore, the Lα phase was chosen for use in design of photogalvanic cell.
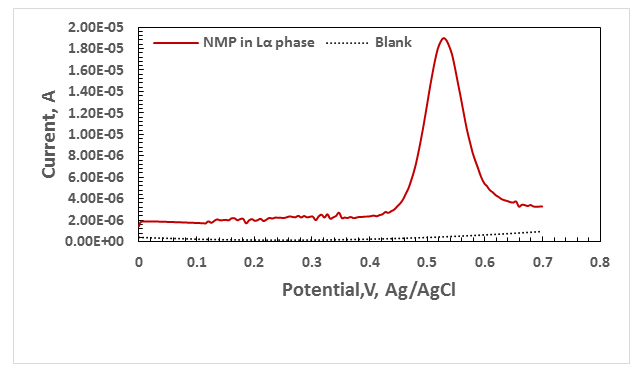
Figure 2 Differential pulse voltammograms of 0.1M of NMP ,in Lα phase, with scan rate 0.05 V/s.
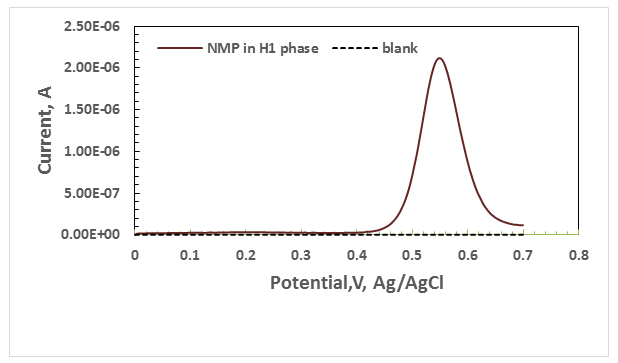
Figure 3 Differential pulse voltammograms of 0.1M of NMP , in H1 phase ,with scan rate 0.05 V/s.
Effect of variation of NMP concentration: Zn | Zn2+,CHCl3 , NMP | ITO
All cells measured in the same conditions (light intensity = 103.2µW/cm2/electrode area = 0.78 cm2/ZnCl2=0.01 M). As we can see from Table 1 increasing in the concentration of NMP there is increasing in the electrical output until reach the maximum point and then decrease.
Table 1. Effect of variation of photosensitizer NMP concentration
| NMP concentration | 0.01 M | 0.1 M | 1 M | 1.75 M | 2 M |
| Photopotential (V) | 0.481 | 0.803 | 0.792 | 0.850 | 0.550 |
| Photocurrent (µA) | 14.1815 | 14.872 | 27.647 | 14.705 | 10.41 |
| Power(µW) | 6.8210 | 11.9420 | 21.89 | 12.499 | 5.73 |
On the lower concentration range of NMP; there is a limited number of photosensitized molecules to absorb the major portion of the light and therefore, a few number of electrons can reach the zinc electrode and a low electrical output was obtained. Table 2 show the calculation of max power density, fill factor and power conversion efficiency for each cell.
Table 2. Calculation of max power density, fill factor and power conversion efficiency for each cell (NMP)
| NMP concentration | Max Power Density | Fill Factor | Power Conversion efficiency |
| 0.01 M | 8.743 µW/Cm2 | 0.226 | 8.472% |
| 0.1 M | 15.3102 µW/Cm2 | 0.256 | 14.835% |
| 1 M | 28.17 µW/Cm2 | 0.242 | 27.305% |
| 1.75 M | 16.012 µW/Cm2 | 0.245 | 15.516% |
| 2 M | 7.346 µW/Cm2 | 0.224 | 7.118% |
Effect of variation of reductant (ZnCl2) concentration:
With the increase in concentration of the reductant the photopotential and photocurrent were found to increase until they reach a maximum value. On further increase in concentration of reductant the decrease in electrical output of The cell was found. graphically the NMP-ZnCl2 system represented graphically in Figure 4, however, table 3 shows the calculation of max power density, fill factor and power conversion efficiency for each cell.
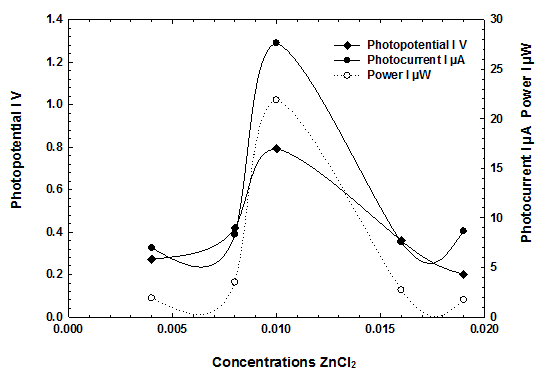
Figure 4 Effect of variation of ZnCl2 concentrations on electrical output
Table 3. Calculation of max power density, fill factor and power conversion efficiency for each cell (ZnCl2)
| ZnCl2 concentration | Max Power Density | Fill Factor | Power Conversion efficiency |
| 0.004 M | 2.4410 µW/Cm2 | 0.2419 | 2.3653% |
| 0.008 M | 4.4789 µW/Cm2 | 0.2507 | 4.3400% |
| 0.01 M | 28.17 µW/Cm2 | 0.242 | 27.305% |
| 0.016 M | 3.4600 µW/Cm2 | 0.2546 | 3.353% |
| 0.019 M | 2.2208 µW/Cm2 | 0.2428 | 2.15203% |
Possible reaction mechanism
Using the analogues reaction16-18 outlined in the introduction section of this document by Girault a reaction mechanism can be postulated.
In the liquid crystal phase
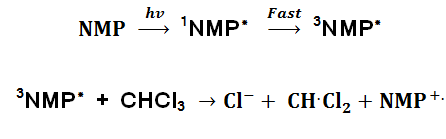
Where 1 NMP* is the excited singlet state and 3NMP* is the excited triplet state.
At the light electrode

At Dark Electrode
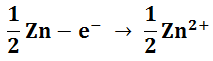
This shows how NMP can be used as the light harvester and the zinc electrode is sacrificial. The excited singlet state is the most likely to be produced on direct excitation however it will quickly relax into the less excited triplet state.
The effect of surfactant in PC:
The use of Triton-X as a replacement to Brij-35 to see the effect of liquid crystal phases on the PC. From UV-Vis spectroscopy and DPV we can see the low absorbance and electrochemical properties this is probably due to the arrangement19 of molecules in H1 phase it causes a lot of refraction and less absorbance than Lα phase of light. It can be seen Figure 5 is not an ideal situation as a lamellar phase with 8.864 % PC.
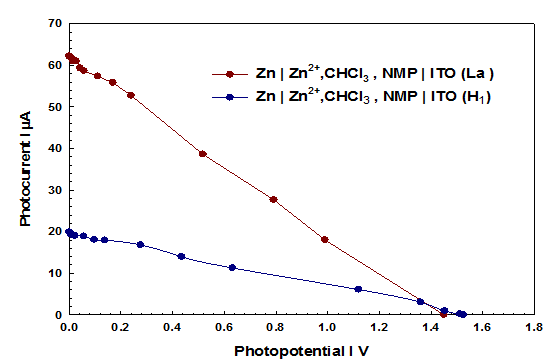
Figure 5 Current-voltage (i-v) curve of the cell (Lα ,H1)
Conclusion and recommendations
This study demonstrates that a photogalvanic cell can be constructed with a high conversion efficiency of approximately 27.305%. While the proposed reaction mechanisms cannot be fully confirmed, they appear to align with the empirical observations, particularly showing that the stepwise reaction is significantly less efficient than the faster, concerted reaction. Notably, the cell is capable of producing power even with minimal chloroform present, highlighting a key feature of interest.
A novel approach to power generation was explored through the construction and optimization of a photogalvanic cell system. The study focused on developing a cell that could utilize industrial run-off or other wastewater sources. Multiple cells were fabricated with varying concentrations of NMP solutions, and their power conversion was analyzed using voltage–current plots. The photogalvanic cell exhibited a photopotential of 0.792 V, a photocurrent of 27.647 µA, and a power output of 21.89 µW. The conversion efficiency was determined to be 27.305%, with a fill factor of 0.242. Additionally, a mechanism for the power generation process was proposed.
References
1. Schmidt, H., C. Siedle, and J. Ketterer, DC/AC converter to convert direct electric voltage into alternating voltage or into alternating current. 2006, Google Patents.
Herman, S., Electrical Studies for Trades. 2013: Nelson Education.2
3. Gangotri, K. and V. Indora, Studies in the photogalvanic effect in mixed reductants system for solar energy conversion and storage: Dextrose and Ethylenediaminetetraacetic acid–Azur A system. Solar Energy, 2010. 84(2): p. 271-276.
4. Zawodzinski, T., S. Minteer, and G. Brisard, Physical and analytical electrochemistry: The fundamental core of electrochemistry. Interface-Electrochemical Society, 2006. 15(1): p. 62-65.
5. Fromhold, A.T., Quantum mechanics for applied physics and engineering. 2012: Courier Corporation.
6. De Leon, C.P., Ferrer, A.F., García, J.G., Szánto, D.A.and Walsh, F.C., Redox flow cells for energy conversion. Journal of Power Sources, 2006. 160(1): p. 716-732.
7. Crabtree, G., Misewich, J., Ambrosio,R., Clay,K., Integrating renewable electricity on the grid. in AIP Conference Proceedings. 2011. AIP.
8. He, Z., Zhong, C., Huang, X., Wong, W.Y., Wu, H.and Cao,Y., Simultaneous enhancement of open‐circuit voltage, short‐circuit current density, and fill factor in polymer solar cells. Advanced Materials, 2011. 23(40): p. 4636-4643.
9. Rolison, D.R., Long,J.W., Lytle,J.C., Fischer,A.E. and Lubers, A.M ., Multifunctional 3 D nanoarchitectures for energy storage and conversion. Chemical Society Reviews, 2009. 38(1): p. 226-252.
10. Halls, J.E. and J.D. Wadhawan, Photogalvanic cells based on lyotropic nanosystems: towards the use of liquid nanotechnology for personalised energy sources. Energy & Environmental Science, 2012. 5(4): p. 6541-6551.
11. Compton, R.G. and C.E. Banks, Understanding voltammetry. 2011: World Scientific.
12. Kounaves, S.P., Voltammetric techniques. 1997, Prentice Hall, Upper Saddle River, NJ, USA. p. 709-726.
13. Andrienko, D., Introduction to liquid crystals. IMPRS school, Bad Marienberg, 2006.
14. Ermakov, S., Beletskii, A., Eismont, O. and Nikolaev, V., Brief Review of Liquid Crystals, in Liquid Crystals in Biotribology. 2016, Springer. p. 37-56.
15. Pirkl, S. and M. Glogarová, Ferroelectric liquid crystals with high spontaneous polarization. 2011: INTECH Open Access Publisher.
16. Rosen, M.J. and J.T. Kunjappu, Surfactants and interfacial phenomena. 2012: John Wiley & Sons.
17. Tamhane, K., Formation of lyotropic liquid crystals through the self-assembly of bile acid building blocks. 2009.
18. Kato,T.,Self-assembly of phase-segregated liquid crystal structures.Science,2002.2002. 295(5564) p. 2414-2418.
19. Whitesides, G.M. and B. Grzybowski, Self-assembly at all scales. Science, 2002. 295(5564): p. 2418-2421.
22. Amos, B., Birefringence for facetors I: what is birefringence? First published in StoneChat, the Journal of the UK Facet Cutter’s Guild. January-March. Edition, 2005.
37. 24. Yano, J. and A. Kitani, Photo-assisted flavin mediated electro-oxidation of NADH model compound using photogalvanic cell. Journal of Electroanalytical Chemistry, 2017.2017. 799: p. 431-435.
42. 25. Halls, J.E., A.A, Altalhi. and F.C.D, Abreu., Concentration-dependent diffusion coefficients of tert-butylferrocene within dodecyltrimethylammonium chloride/brine liquid crystals. Electrochemistry Communications, 2012. 17: p. 41-44.
45. 26. Halls, J.E., K.J. Wright., J.E. Pickersgill., J.P. Smith. and A. A. Altalhi., Voltammetry within structured liquid nanosystems: Towards the design of a flexible, three-dimensional framework for artificial photosystems. Electrochimica Acta, 2012. 70: p. 215-227.
27. Archer, M., Electrochemical aspects of solar energy conversion. Journal of Applied Electrochemistry, 1975. 5(1): p. 17-38.