
Introduction
Globally, coffee is one of the most widely consumed beverages, with an estimated average daily consumption of 2.3 billion cups per day (Higdon and Frei, 2006). Despite its popularity, the consistent supply of high-quality coffee beans is often limited due to challenges encountered during harvesting and post-harvesting processes. As a result, defective coffee beans frequently enter the domestic market and are consumed locally (Craig et al., 2012). In Brazil, defective beans account for approximately 20% of total coffee production, and similar proportions are likely in other coffee-producing regions worldwide (Mazzafera, 1999; Ramalakshmi, 2007). In Ethiopia, the percentage of defective beans is reported to be even higher compared to other countries (Belay et al., 2014).
Each coffee-producing nation has established its own classification system to identify defective beans. Traditionally, coffee quality assessment involves roasting, grinding, brewing, and tasting samples, a procedure commonly known as “cupping.” While cupping is widely used, it is highly subjective, time-consuming, and relies heavily on the expertise of trained cuppers (Frei, 2002). This underscores the need for faster, more reliable scientific methods to evaluate coffee quality both before and after roasting.
In recent years, research on defective coffee beans has intensified due to increasing awareness of their negative impact on the quality of green and roasted coffee intended for consumption (Franca et al., 2005; Mendonca et al., 2009). Studies have shown that defective and non-defective coffee beans exhibit notable differences in their physical and chemical properties prior to roasting. However, only a few studies have achieved reliable discrimination between defective and non-defective beans before roasting. Belay et al. (2014) demonstrated that physical properties alone could effectively separate defective from non-defective beans both before and after roasting. Similarly, Mendonca et al. (2009) employed sieving techniques to distinguish defective and non-defective roasted beans.
Other researchers (Franca et al., 2005; Farah et al., 2006; Ramalakshmi et al., 2007; Craig et al., 2011, 2012) explored chemical approaches, including direct diffuse reflectance FTIR and HPLC, to quantify caffeine and chlorogenic acids (CGA) and to discriminate between defective and non-defective coffees. While these chemical techniques are highly effective for determining caffeine and CGA content, they require expensive instrumentation, organic solvents, and labor-intensive sample preparation. Caffeine and CGA extraction commonly uses solvents such as benzene, chloroform, trichloroethylene, and dichloromethane (Zhang et al., 2005), which pose health and environmental hazards. In the present research, first-order derivative spectroscopy was applied for the determination of caffeine and CGA in defective and non-defective coffee beans without the need for prior extraction, pre-separation, or background correction. To the best of the author’s knowledge, no previous study has reported the simultaneous determination of caffeine and chlorogenic acids in defective and non-defective coffee beans using first derivative spectra as a tool for coffee quality assessment.
Thus, this approach offers a rapid, simple, and cost-effective method for determining the levels of bioactive compounds in coffee beans. The primary objective of the present study was to apply first-order derivative spectra as a direct, efficient, and inexpensive scientific technique for the quantitative determination of caffeine and chlorogenic acids in defective and non-defective coffee beans.
Chemicals and Samples
Caffeine (Evan, England) and chlorogenic acid (Aldrich-Sigma, Germany) were used to prepare the standard solutions for analysis. To determine the levels of caffeine and chlorogenic acids in defective and non-defective Arabica coffee beans, samples were collected from three areas within the Oromia Regional State of Ethiopia: Geri, Sorgeba, and Nano Chala.
From each area, coffee samples were randomly collected and then carefully sorted into defective and non-defective categories by an experienced coffee quality expert from the Oromia Coffee Farmers Cooperative Union. The defective beans included immature, black, and sour beans, while the remaining beans were classified as non-defective. Figure 1 illustrates the green Ethiopian coffee beans divided into four categories: defective (immature, black, sour) and non-defective
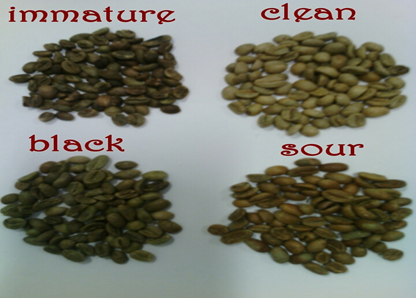
Fig. 1 Coffee beans sorted into four lots: defective (immature, black, and sour) and non-defective.
Apparatus and Instrumentation
The experiment utilized the following laboratory apparatus: various beakers and measuring cylinders, a magnetic stirrer equipped with a hot plate, a separating funnel, glass filters, a 1 cm quartz cuvette, and a 250 µm sieve. To record the absorption spectra of standard solutions (caffeine and chlorogenic acid) as well as coffee samples, a double monochromator UV-Vis-NIR spectrometer (Perkin Elmer, Germany) was employed. The instrument was operated using its dedicated software package, UVCSS.
For spectral derivative analysis, Origin 8 software was used, following the established methodologies reported by Alpdogan et al. (2002), Sanchez et al. (1983), Savitzky et al. (1964), and Talsky (1994). Methods of the experiment
Calibration curve for the standard solution of caffeine and CGA
Preparation of Standard Solutions and Calibration
The stock solution of caffeine was prepared by dissolving 5 g of caffeine in 100 mL of distilled water. This stock solution was subsequently diluted to obtain a series of standard solutions with varying concentrations. The UV-Vis absorption spectra of these standard solutions were recorded against a blank solution over a wavelength range of 200–400 nm at room temperature.
Similarly, a stock solution of chlorogenic acids (CGA) was prepared by dissolving 6 g of chlorogenic acids in 100 mL of distilled water. This solution was also diluted to produce a series of concentrations for calibration purposes. The UV-Vis absorption spectra of the chlorogenic acids standards were recorded against water over the same wavelength range (200–400 nm) at room temperature. First-order derivative spectra of the caffeine standard solutions were obtained, and absorption spectra versus concentration were plotted using the “baseline-to-peak” measurement technique, following the calibration procedure described by Gorry (1990). In the same manner, first-order derivative absorption spectra for the chlorogenic acids standard solutions were recorded. Linear regression was applied to the data to derive the regression equations for both caffeine (CAF) and chlorogenic acids (CGA) standard solutions.
Preparation of Coffee Samples and Determination of Caffeine and Chlorogenic Acids
For sample analysis, 0.02 g of sieved, ground raw coffee was added to 50 mL of distilled water in a beaker. The mixture was stirred for 1 hour at room temperature using a magnetic stirrer to ensure complete extraction. The UV-Vis absorption spectra of each coffee sample were recorded, and the corresponding first-order derivative spectra were obtained. The absorption peaks at 256 nm and 292 nm were used to identify caffeine and chlorogenic acids, respectively. The concentrations of caffeine and chlorogenic acids in the coffee samples were calculated from the linear regression equations derived from the standard calibration curves, using the extreme points from the first-order derivative spectra.
Results and Discussion
UV-Vis Spectra of Caffeine and Its First-Order Derivative Spectra
Figure 2 illustrates the UV-Vis absorption spectra of caffeine at different concentrations (4, 5, 6, and 7 µg/mL). The UV-Vis absorption of caffeine in water was observed in the 200–400 nm wavelength range at room temperature. The peak absorbance of pure caffeine in aqueous solution occurred at λ_max = 272.8 nm. The maximum absorbance observed in this study closely matches values reported in previous studies (Abebe et al., 2008), indicating the reliability of the experimental procedure.
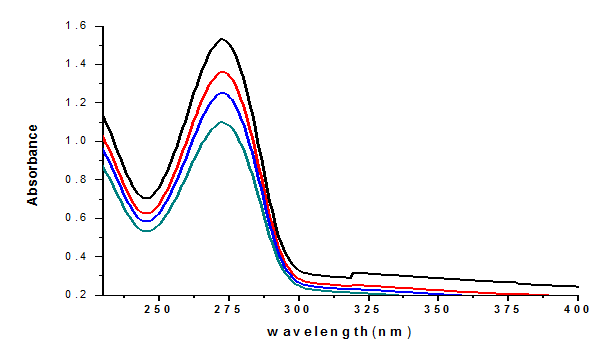
Fig.2 UV-VIS absorption spectra of caffeine at different concentrations (4-7µg/ml) in water
The first-order derivative UV-Vis absorption spectra of standard caffeine solutions were recorded, as shown in Fig. 3. The peak absorbance was observed at a wavelength of λ_max = 260 nm, which exhibited a leftward shift of 12 nm. The baseline-to-peak measurement at this peak wavelength (λ_max = 260 nm) was employed for the construction of the calibration curve.
A linear relationship was established between the peak amplitude (y) of the first-order derivative spectra at the extreme wavelengths and the caffeine concentration. The resulting regression equation was:

where y represents the peak height at λ = 260 nm, and x denotes the caffeine concentration in µg/mL. This linear regression equation derived from the calibration curve of the first-order derivative spectra of pure caffeine was subsequently used to determine the caffeine content in coffee bean samples.
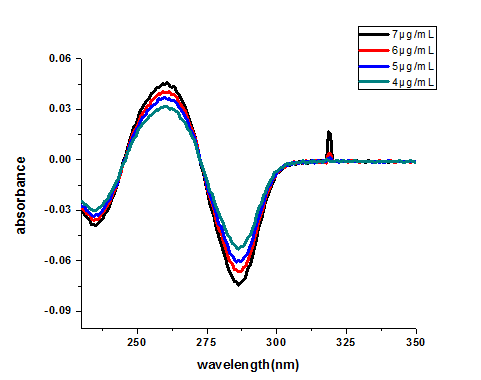
Fig.3 first order derivative spectra of caffeine standards at different concentrations
Linear relationships were obtained between the caffeine concentrations and peak amplitude (y) of first order spectra at the extreme wavelength. The regression equation was (y=0.000439x+0.000975, R2=0.99), where y-represent the peak height at λ=260.13nm and x-concentration in µgm/mL. Linear regression equation of the calibration curve of the first order derivative spectra of pure caffeine were used to calculate the concentration of caffeine in coffee beans.
Determination of the contents of caffeine in defective and non-defective coffee beans by first derivative spectra
Direct measurement of caffeine in coffee beans using UV-VIS spectrophotometry cannot possible in the wavelength regions of 200-400 nm due to spectral interference (Belay et al., 2008). The concentrations of caffeine in defective and non-defective coffee beans calculated from the regression equation and the results were summarized in Table 1.
Table 1: Caffeine content in defective and non-defective coffee samples obtained using first order derivative spectra and literature values
| Coffee samples | Caffeine contents (%) | |
| The present study values | Literature values | |
| Immature | 1.46 + 0.47 | 0.96-1.23 (Farah et al.,2006), |
| Black | 1.34 + 0.34 | 1.19- 1.44 (Purcarea et al., 2006) |
| Sour | 1.34 + 0.34 | 1.19- 1.44 (Purcarea et al., 2006) |
| Non-defective | 1.20 + 0.20 | 0.6 – 1.9 (Clarke and Macare, 1985) |
As presented in Table 1, the mean caffeine content in coffee beans varied among different sample types. Immature coffee beans showed the highest caffeine level at 1.46 ± 0.47%, followed by black and sour beans at 1.34 ± 0.34%, while non-defective beans exhibited the lowest caffeine content at 1.20 ± 0.20%. Overall, the caffeine levels across the four coffee samples (immature, black, sour, and non-defective) ranged from 0.6% to 1.90%, which aligns with previously reported values in the literature. For instance, spectrophotometric determination of caffeine using dichloromethane as an extraction solvent indicated caffeine concentrations ranging from 1.20% to 1.48% in chloroform and 1.19% to 1.44% in distilled water (Purcarea et al., 2006).
The caffeine contents measured in the present study are consistent with values obtained using other analytical techniques. For example, HPLC analysis of green Arabic coffee reported caffeine contents ranging from 0.96 ± 0.01% to 1.23 ± 0.06% (Farah et al., 2006). Additionally, derivative spectrophotometry methods determined caffeine content in coffee at 1.36 ± 0.03% (Alpdogan et al., 2002). Table 1 also indicates that there was no significant difference in caffeine content between black and sour coffee samples (1.34 ± 0.34%), which concurs with earlier reports showing minimal variation in caffeine levels between defective coffee beans (Mazzafera, 1999; Clarke and Macrae, 1985). Furthermore, other studies have shown that non-defective coffee beans generally have lower caffeine content compared to defective ones, with average caffeine levels in Arabic coffees typically below 1.5%. The slight differences observed in caffeine content across studies can be attributed primarily to variations in extraction methods.
The relationship between caffeine content and coffee cup quality remains unclear and somewhat controversial. Some studies using UV-VIS spectrophotometry reported higher caffeine concentrations in high-quality (non-defective) coffees compared to low-quality (defective) ones. However, in the present study, caffeine levels were higher in lower-quality coffees (immature, black, and sour) compared to non-defective beans, which aligns with previous findings indicating that defective beans may contain higher caffeine content.
UV-VIS Absorption Spectra of CGA and Its First-Order Derivative Spectra
The UV-VIS absorption spectra of chlorogenic acid (CGA) were recorded over the wavelength range of 200–400 nm at room temperature (Fig. 4). Within this range, CGA exhibited two absorption maxima: the first at 216.8 nm with a shoulder around 242 nm, and the second at 324 nm, which corresponds to the HOMO–LUMO electronic transition, primarily associated with electron density localization on the benzene ring and carbon chain (Cornard et al., 2008). A minimum absorption point was observed at 262.5 nm, consistent with previous reports (Abebe and Gholap, 2009).
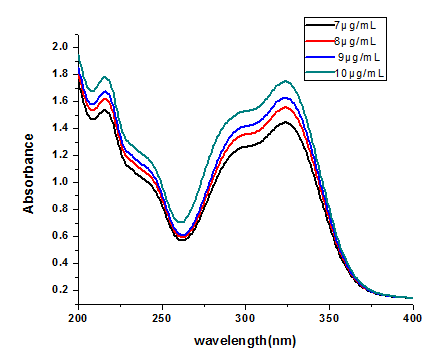
Fig 4 UV-VIS absorption spectra of CGA at different concentrations
The first order derivative absorption spectra of CGA standard solutions were shown in Fig 5.. Baseline-to-peak measurement of peak wavelength L max=292 nm was used for preparation of calibration Curve. Linea relationships were obtained between the caffeine concentration and peak amplitude (y) of first order spectra. The regression equation (y=0.0.14036x+0.053628, R2=0.98) were obtained, where y-represent the peak height and x-concentration in µgm/mL.
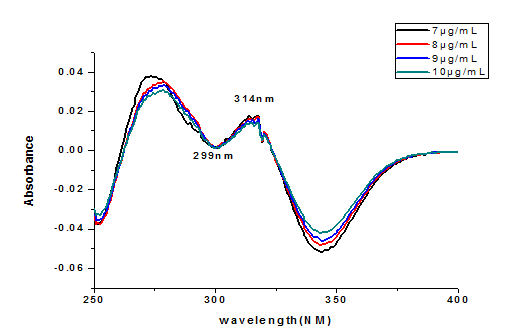
Figure 5 first order derivative spectra of CGA standards in water at different concentrations
Determination of level of CGA in defective and non-defective beans using first order derivative spectra
A UV-spectrophotometric method cannot be used directly for the determination of CGA like caffeine as it has been discussed above in coffee owing to the matrix effect of UV-absorbing substances in the sample matrix (Zhang et al., 2005, Belay and Gholap 2009). In order to alleviate this difficulty, some tedious background correction techniques have to be used]. In contrast, the derivatization of the absorption spectrum and measurement of the derivative absorbance values allow the elimination of matrix effects because the variable background absorptions overlapping the analyte peaks are smoother in derivative spectra. Fig 5 the first order derivative UV-Vis absorption spectrum of CGA solutions. The concentrations of CGA in defective and non-defective coffee beans were calculated using the regression equation and the results are summarized in Table 2.
Table 2 the content CGA in defective and non-defective coffee samples determined using first order derivate spectra and literature values
| Coffee samples | CGA contents (%) | |
| The present study values | Literature values | |
| Immature | 4.43 + 0.43 | 1.3 – 8.7 (Farah et al., 2005) 5.5 – 8.0 (Clarke and Macare, 1985) 6.05 – 6.25 (Belay et al, 2009) 4.1 – 7.9 (Farah et al., 2006) |
| Black | 4.26 + 0.38 | |
| Sour | 4.26 + 0.38 | |
| Non-defective | 4.07 + 0.07 | |
The mean percentages of chlorogenic acids (CGA) in the coffee beans analyzed were 4.43 ± 0.43% for immature beans, 4.26 ± 0.38% for black beans, 4.26 ± 0.38% for sour beans, and 4.07 ± 0.07% for non-defective beans. The highest CGA content was observed in immature coffee samples, while the lowest content was found in non-defective beans, consistent with the findings of Clifford and Wilson (1987). Overall, the levels of chlorogenic acids determined in this study are comparable to previously reported values for total CGA in green Arabica coffee beans, which range from 4.0% to 8.4% (Farah et al.; Ky et al., 1997, 2001).
The results also indicate an inverse relationship between total CGA levels and coffee quality. Higher CGA concentrations were observed in lower-quality samples (defective beans), in agreement with Farah et al. (2005), who reported a strong inverse association between CGA content and cup quality. Further analysis of eight CGA isomers in defective coffee beans revealed that immature and black defective beans contained significantly higher levels of all CGA isomers, particularly caffeoylquinic acid (CQA) and feruloylquinic acid (FQA), compared to non-defective beans. These observations are in good agreement with the present study. Similarly, Mazzafera (1999) reported that immature and black defective beans exhibited higher total CGA contents compared to non-defective beans.
Taken together, both previous studies and the current results suggest that CGA content is inversely related to coffee quality, with CQA accounting for at least 60% of total CGA. Higher CQA and CGA levels are thus likely to be associated with lower cup quality.
Conclusions
First-order derivative spectra were successfully employed as a method for the determination of caffeine and chlorogenic acids in defective and non-defective coffee beans. The results confirm that this derivative spectral method is highly effective for eliminating interfering matrices and allows the accurate quantification of caffeine and CGA without requiring background correction or additional reagents.
Considering the outcomes of this study, it can be concluded that the developed method is simple, rapid, and cost-effective, making it suitable for routine analysis of caffeine and CGA in coffee beans. This technique can provide a basic characterization of defective and non-defective beans prior to market shipment. Importantly, the study highlights that caffeine and chlorogenic acids are major compounds closely associated with coffee quality. Higher concentrations were consistently observed in defective beans (immature, dark, and sour), whereas lower levels were found in non-defective or clean coffee beans, underscoring their relevance as markers of coffee quality.
References
- Adriana, F. (2012): Coffee: Emerging Health effect and Disease Prevention, John
- Wileey & Sons, Inc., 1:27-39.
- Alpdogan, G., Kariban, K., Sungur, S. (2002): Derivative Spectrophotometric Determination of caffeine in some Beverages, Turkish Journal of Chemistry 26: 295-302
- Belay, A., Ture, K., Redi, M., & Asfaw, A. (2008). Measurement of caffeine in coffee beans by UV–Vis spectrometer. Food Chemistry, 108, 310–315.
- Belay, A., Bekele, Y., Abreha, A., Comen, D., Yyung, K., Kim, Y.K., Hwang, Y.H. (2014): discrimination of defective (full black, full sourand immature) and nondefective coffee beans by their physical properties, Journal of Food Process Engineering, 37: 524-532
- Belay,A, Gholap, A. V. (2009): Characterization and determination of chlorogenic acids (CGA) in coffee beans by UV-Vis Spectroscopy, African Journal of Pure and Applied Chemistry 3(11): 234-240
- Craig, A.P., Franca, A.S. and Oliveira, L.S. 2011.Discrimination between immature and mature green coffees by attenuated total reflectance and diffuse reflectance Fourier transform infrared spectroscopy. J. Food Sci. 76, C1162–C1168.
- Craig, A.P., Franca, A.S. and Oliveira, L.S. 2012. Discrimination between defective and non-defective roasted coffees by Diffused Reflectance Infrared Fourier Transform. LWT – Food Sci. Technol. 47, 505–511.
- Clarke, R.J., Macarae, R. (1985): Coffee, Elsevier, New York, 1.
- Clifford, M.N., Wilson, K.C. (1987): Coffee botany, Biochemistry and production of
- beans and beverage, London
- Clifford, M. N. (2000): Chlorogenic acids and other cinnamates—nature, occurrence, dietary, absorption and metabolism,J. Sci. Food Agric., 80: 1033–1043.
- Cornard JP, Lapouge C, Dangleterre L, Allet-Bodelot (2008). Complex of Lead (II) by chlorogenic acid: Experimental and theoretical study. J. Phys.Chem. A 112: 12475-12484
- Craig, A.P., Franca, A.S., Oliveira, L.S. (2012): Discrimination between defective and non-defective roasted coffees by Diffused Reflectance Infrared Fourier Transform,LWT Food Sci. Technol. 47: 505–511
- Farah A, Paulis TD, Trugo, L.C., Martin, P.R. (2005): Effect of roasting on the Formation of Chlorogenic Acid Lactones in Coffee, Journal of agricultural and food chemistry,53:1505-1513.
- Farah, A, Monteiro, M.C, Calado, V., Franca, A.S, Trugo, L.C. (2006): Correlation between cup quality and chemical attributes of Brazilian Coffee, Food Chemistry, 98: 373-380.
- Farah A, Donangelo, C.M. (2006): Phenolic compounds in coffee, Brazlian Journal of Plant Physiology, 18: 23-36.
- Farah, A, Monteiro, M.C, Calado, V., Franca, A.S, Trugo, L.C. (2006): Correlation between cup quality and chemical attributes of Brazilian Coffee, Food Chemistry, 98: 373-380
- Feria, A. M. (2002): Examining the case of green coffee to illustrate the limitations of grading systems/expert tasters in sensory evaluation for quality control,Food Quality and Preference, 13: 355-367
- Franca, A. S., Oliveira, L. S., Mendonca, J. C. F., Silva, X. A. (2005): Physical and chemical attributes of defective crude and roasted coffee beans, Food Chemistry, 90: 84–89.
- Gorry, P.A. (1990): Anal. Chem. 62: 570-573
- Higdon, J.V., Feri, B. (2006): Coffee and Health; A Review of recent human research,
- Food Science and Nutrition, 46: 101-123.
- Ky CL, Noirt M, Hamon S (1997). Comparison of five purification methods for chlorogenic acid in green coffee beans. J. Agric. Food Chem. 45: 786-790.
- Ky CL, louarn J, Dussert S, Guyot B, Hamon S, Noirot M (2001). Caffeine, trigonelline, chlorogenic acids and sucrose diversity in wild coffee Arabica L. and C. canephora P. accessions. Food Chem. 75: 223-230.
- Mazzafera, P. (1999): Chemical composition of defective coffee beans, Food Chemistry, 64: 547–554.
- Mendonça, J. C. F., Franca, A. S., Oliveira, L. S. (2009): Physical characterization of
- non-defective and defective Arabica and Robusta coffees before and after roasting, Journal of Food Engineering: 92:474-479
- Ramalakshmi, K., Kubra, I. R., Rao, L. J. M. (2007): Physicochemical characteristics
- of green coffee: comparison of graded and defective beans, Journal of Food Science, 72: 333-337
- Petracco, M., Illy, A., Viani, R. (2005): The Cup Espresso Coffee: The Science
- of Quality, ed. by IllyA and VianiR, Academic Press, London: 290-315.
- Purcarea, C., Chis, A., Vicas, S., Fodor, A. (2008): Comparative Studies about Caffeine Content in Roasted Ground Coffee and in China Black Tea, Ecotoxicolgie, Zootehnie si Tehnologii de Industrie Alimentara, 7: 966-971.
- Sanchez, R.E, Bosh, O., Jeda, C., Cano, P.J.M. (1988): Talanta, 35, 753.
- Savitzky, A., Golay, M.J. E. (1964):Anal. Chem., 36:1627-1642.
- Shearer, J., Sellars, E., Farah, A., Graham, T.E., Wasserman, D.H., (2007): Effects of
- chronic coffee consumption on glucose kinetics in the conscious rat, Can. J. Phys. Pharm.,85: 823–830.
- Talsky, G. (1994): Derivative Spectrophotometry, 1st ed., VCH, Weinheim
- Zhang,Q.L., Lian, H.Z., Wang, W.H.,Chen, H.Y. (2005): Separation of Caffeine and
- Theophylline in Poly (Dimethylsiloxane) Micro Channel Electrophoresis with Electrochemical Detection.,Journal ofCaffeine and Chromatography A, 1098: 172-176.
Pingback: lasix generic
Pingback: cialis generico
Pingback: female viagra
Pingback: vardenafil 20mg
Pingback: lasix furosemide tablet
Pingback: flagyl for uti
Pingback: lasix furosemide price
Pingback: voriconazole brand
Pingback: cheap levitra pills