
Introduction: Irrigation water quality critically affects soil physical structure, crop yield and long-term sustainability of agricultural land. Salinity, sodium hazard, specific ion toxicities (e.g., boron, chloride) and infiltration problems are the main concerns when evaluating water for irrigation. The Food and Agricultural Organization (FAO) guidelines remain the principal international reference for assessing irrigation water suitability and recommended limits for key parameters (salinity, SAR, specific ion toxicity and infiltration effects) [1].
Water quality indices (WQIs) and specialized irrigation indices such as the Irrigation Water Quality Index (IWQI) convert complex, multivariate water chemistry into simple, actionable classes and maps for managers and farmers. The IWQI and its derivatives has been widely adopted in semi-arid and urbanizing regions and is useful when integrating multiple parameters (EC, SAR, Na⁺, Cl⁻, HCO₃⁻, etc.) into a single suitability score [2].
Bhopal’s lakes and groundwater has been the subject of previous water quality studies; urbanization and post monsoon recharge processes can alter concentration and distribution of ions and contaminants. Local studies on surface water and groundwater trends provide a regional context for interpreting post monsoon irrigation suitability in the Bhopal area [3]. The main objectives of this study were, (1) To measure physicochemical parameters of nine representative water sources in Bhopal during the post monsoon period, (2) To compute irrigation relevant indices (SAR, RSC, IWQI), (3) To classify irrigation suitability and provide management recommendations.
2. Study Area and Sampling Sites
For this study, we selected four surface water sources and five groundwater sources in Bhopal City (Figure 1). The surface water sources collected were the Kolar Dam (SW1), Kaliasote Dam (SW2), Kerwa Dam (SW3), and one lake, Bhojtal (SW4). The groundwater sources were gathered from five villages of Huzur Tehsil. These were Sagoni Kalan (GW1), Kolua Khurd (GW2), Chhawani Pathar (GW3), Khajuri Khurd (GW4), and Kerwa (GW5). Kolar Dam is an earthen dam built on the Kolar River, which is a tributary river of the Narmada River [4]. It is located in Lawakhewari village of Sehore district between 22.9° N and 77.3° E coordinates, 35 km southwest of Bhopal. Kaliasote Dam is constructed on the river Kaliasote, which is a tributary of the river Betwa. It is near WALMI (Water and Land Management Institute), located between 23.1° N and 77.2° N coordinates [5]. Kerwa Dam is an earthen dam built in Mandora village between 23.17° N and 77.3° E coordinates [6]. It is 15 km away from the city. The Bhojtal is a large lake and a major drinking water source in Bhopal. It is situated on the western side of the city and serves 40% of the population. It is between 23.15° N and 77.2° E coordinates [7].
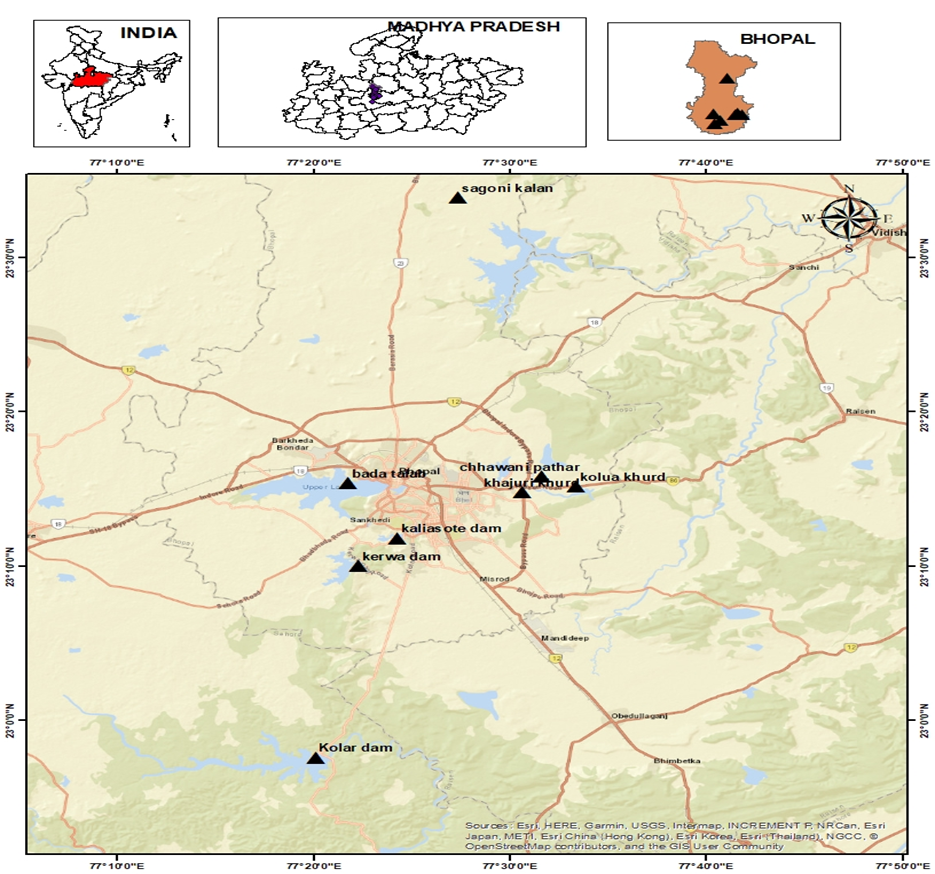
Figure 1. Location Map of Study Area
2.1 Climate & hydrology- Bhopal is located at just the upper limit of Vindhyachal mountain range situated on the Malwa plateau in central India. Topographically it has small hills and plains of alluvial soil. The slop of hills is towards north and southeast. The entire western part of Bhopal is situated on Malwa plateau. The total rainfall in Bhopal is about 1146mm. It is highest in July and August (339.6mm and 352.1mm) respectively. In April it is minimum (4.8mm).The south west Monsoon brings most of the rainfall. Bhopal has humid subtropical climate. The summer remains from March to mid June. The average temperature is 30°C which is highest in May (40°C). The Monsoon starts from late June and ends in September last. The season of winter is from early November to February last. It has the average temperature of 16°C. Hydro geologically the groundwater resides in porous, fractured and jointed basalt rocks of Deccan traps. This water is harnessed in the forms of dug wells, tube well, bore wells etc. These sources can be found in depth from 4-20m and water level is achieved from 2 to 14 mbgl (Meters below ground level). In Vindhyan rocks constructed by limestones, sandstones and carbonate rocks porous water holding cavities are found which may store a large quantity of groundwater. The surface water comes from rainfall and stores in depressions in the form of lakes, ponds, manmade dams and some seasonal rivers.
3. Materials and Methods
- Sampling and preservation
Thesampling period of this study was post monsoon (Sept 23 to Feb 24). Total 54 samples collected from 9 numbers of sites were analysed. The samples collected following standard protocols (pre-rinsed polyethylene bottles for most parameters; acidified samples for metal analysis where applicable). Field measurements for pH, temperature, and EC were taken in situ with calibrated probes. Samples were stored at 4 °C and analyzed within recommended holding times. Methods for collection and preservation follow APHA’s 23rd edition 2017 [8].
3.2 Laboratory analyses
Analyses were performed using standard procedures (APHA’s 23rd edition 2017). The results obtained were compared with permissible values given by the World Health Organisation (WHO 2022, IVth edition, I and II addenda) and Bureau of Indian Standards (BIS-10500:2012, reaffirmed in February 2021) [9.10]. The following physicochemical parameters were analysed,
- The pH – It was measured using a digital pH meter.
- Total Dissolved Solids -It was determined by gravimetric analysis.
- Biochemical Oxygen Demand -It was measured by the 5-day incubation method.
- Chemical Oxygen Demand -It was determined using the dichromate reflux method.
- Total Alkalinity -It was estimated using titration with H2SO4.
- Total Hardness – It was determined by EDTA titration.
- Conductivity – It was measured using a conductivity meter.
- Turbidity – It was measured using a nephelometer.
- Iron -It was estimated using AAS.
- Nitrate -It was measured by the UV spectrophotometric method.
- Fluoride -It was determined by an ion-selective electrode method.
- Chloride -It was measured by argentometric titration.
- Calcium -It was determined by EDTA titration.
- Magnesium -It was determined by EDTA titration.
- Sulfate -It was measured using a turbidimetric method.
- Manganese -It was estimated using AAS.
- Sodium and Potassium -These were estimated using the Electro Neutrality Principle (ENP) and validated by percentage electro-neutrality (% EN) [11]. However, we can apply an approach or assumptions, based on a typical Na⁺ to K⁺ Ratio. If we assume a common Na⁺ to K⁺ ratio in natural waters (e.g., around 10:1), we can estimate the proportions of each within the total cation concentration. To calculate the amounts of sodium (Na⁺) and potassium (K⁺) ions in the water sample first, we need to convert the concentrations of the ions to milliequivalents per liter (meq/L) [12]. The formula to convert mg/L to meq/L is,
Now total anions and total cations are calculated in meq/L and then following formula is applied,

Now individually Na and K ions can be calculated by assuming a Na+ to K+ ratio that is commonly around 10:1. So,
To calculate the percentage electroneutrality error (ENE) for water following formula should be followed,

Where, ENE = Electroneutrality error
This gives the percentage difference between total cations and anions, indicating the degree of electroneutrality. Ideally, the percentage electroneutrality error should be less than 5%. If it’s higher, this may indicate missing ions in the analysis or measurement errors. This calculation helps ensure that the water’s ionic composition is balanced and that no major ions have been overlooked.
- Bicarbonate -The bicarbonate concentrations were calculated numerically from total alkalinity due to the absence of carbonate ions (CO32-) at pH levels below 8.3 [13]. For this purpose following formula had been used,
3.3 Calculated indices and formulas
All ionic concentrations must be converted to milliequivalents per liter (meq/L) where required.
3.3.1 Sodium Adsorption Ratio (SAR)
It is used to determine the effect of sodium on soil permeability. The SAR is an empirical water quality assessment criterion which is essential for irrigation waters [14]. It can be calculated as follows-

Where, all values are in meq/L.
When SAR value is 0-10, water is classified as S1 which means low Na water. From 10-18, water is classified as S2 and such water is of medium Na water. The SAR of 18-26, water is categorized as S3 and this water is of high Na water and greater than 26, water is regarded as S4 which suggests that very high Na water. The SAR is a standard diagnostic parameter for sodicity hazard of a soil also. It is a ratio hence unit less.
3.3.2 Residual Sodium Carbonate (RSC)
It is used to assess the potential risk of soil alkalinity. It is not frequently used because having similarity with SAR expressing the Na content in relation with Ca and Mg. It is used to know the harmful consequences of carbonates and bicarbonates on water quality for irrigation [15]. It can be known by the following formula-
Where all value are in meq/L
If RSC value is below 1.25 meq/L it indicates that waters are safe for irrigation. If it is from 1.25 meq/L to 2.5 meq/L waters are marginally safe while the value is more than 2.5 meq/L means waters are not appropriate for irrigation without treatment. A negative RSC indicates that the water has no risk of sodium accumulation and is generally safe for irrigation. Such water is considered good quality for irrigation purposes, as it promotes favorable soil conditions by reducing sodium related issues.
- Magnesium Hazard (MH) – It is used to assess the impact of magnesium on soil fertility. It is also known as Magnesium Ratio (MR). Too much Mg is regarded to be harmful for plants, but Ca counter balance it when present [16]. It can be calculated as-
Where, all values are in meq/L.
When, MH is greater than 50. The waters are considered to be harmful for irrigation.
- Kelly’s Index (KI) – This index is applied to evaluate sodium dominance in water. It is also a way to classify water for irrigation purpose [17]. If it is more than 2 it means there is an excess of Na and such water is unsuitable for irrigation. If it is less than 1 it tells deficit of Na in water and water is suitable for irrigation. If it lies between 1-2 that informs water is marginally suitable for irrigation. It is computed by the formula,
Where value are in meq/L
3.3.3 Irrigation Water Quality Index (IWQI)
To assess the overall irrigation water quality, we integrated individual indices like SAR, RSC, KI, and MH into a composite Irrigation Water Quality Index (IWQI) method [18]. This gives a single, comprehensive score for comparing multiple surface water samples or sites. To Incorporate SAR, RSC, KI, and MH into an irrigation water quality index we did this using a weighted arithmetic index approach, similar to the drinking water quality index. Here is step-by-step composite IWQI calculation,
Step 1 Calculation of each parameter – We calculated for each water sample the SAR, RSC, KI, and MH and EC (Electrical Conductivity) or TDS (Salinity).
Step 2 Assigning of a quality rating (Qi) to each parameter – Each index was compared to standard threshold values and given a quality rating (Qi), usually on a scale of 0 to 100, where,
0–25 = Excellent, 26–50 = Good, 51–75 = Poor, and 76–100 = Unsuitable
We set custom Qi formulae or ranges for each parameter. For example,
| SAR Value | Qi (SAR) |
| 0–10 | 0–25 |
| 10–18 | 26–50 |
| 18–26 | 51–75 |
| >26 | 76–100 |
We repeated this logic for RSC, KR and MH also.
Step 3 Assigning of weights (Wi) – We assigned a weight to each parameter based on its relative importance in affecting irrigation quality. Example,
| Parameter | Weight (Wi) |
| SAR | 4 |
| RSC | 3 |
| KR | 2 |
| MH | 2 |
| EC | 4 |
Higher weights were given to more critical parameter for irrigation quality.
Step 4 Calculation of Weighted Quality Score – It was done like,
We did this for each parameter.
Step 5 Computation of final IWQI – This was calculated using the following formula,
This yields a single irrigation water quality index score.
Step 6 Classification of Overall Water Quality for Irrigation – It was performed using below
| IWQI Range | Irrigation Suitability |
| 0–25 | Excellent |
| 26–50 | Good |
| 51–75 | Poor |
| 76–100 | Unsuitable |
We can adjust ranges based on local or crop-specific standards. This index combines multiple parameters into one score. It helps to compare sites/samples over time and simplifies decision making for irrigation planning
3.4 Hydrochemical Analysis
This was performed using Wilcox diagram.
3,4,1 Wilcox Diagram – This was used to assess the suitability of water for irrigation. The Wilcox plot is a powerful tool for assessing water quality for agricultural irrigation, applicable to both surface water and groundwater [19]. It highlights salinity and sodium hazards, providing actionable insights for soil and crop management. The Wilcox diagram is widely used in hydrogeology and agriculture to evaluate the suitability of water for irrigation. It assesses the potential impacts of water salinity and sodium hazards on crops and soil [20]. The purpose to use the Wilcox plot is primarily designed to classify irrigation water quality based on its salinity and sodium content. And to assess potential soil degradation risks, such as reduced permeability and sodicity. It guides agricultural water management, particularly in areas where irrigation is a primary water use. The classification zones of the plot is divided into four main salinity classes (S1 to S4) and four sodium hazard classes (C1 to C4) as follows,
- Salinity Classes (C1 to C4) – It includes,
- C1 (Low Salinity) – Suitable for most crops.
- C2 (Medium Salinity) – Requires moderate leaching.
- C3 (High Salinity) – Tolerant crops and special management required.
- C4 (Very High Salinity) – Generally unsuitable for irrigation.
- Sodium Hazard Classes (S1 to S4) – It includes,
- S1 (Low Sodium Hazard) – Safe for all soils.
- S2 (Medium Sodium Hazard) – May require gypsum addition for sensitive soils.
- S3 (High Sodium Hazard) – Harmful for most soils without treatment.
- S4 (Very High Sodium Hazard) – Unsuitable for irrigation.
It is applied in groundwater chemistry to know irrigation suitability. Groundwater often exhibits high salinity or sodium levels due to mineral dissolution and long residence times. Wilcox plots help to classify groundwater for agricultural use and identify treatment needs (e.g., gypsum application). It is applied in assessing aquifer quality through helping monitor changes in groundwater quality over time, especially in areas with heavy agricultural use. It is applied in surface water for identifying seasonal variability. Surface water quality can vary seasonally due to runoff or evaporation. Wilcox plots can track these changes. It is used in irrigation management. Rivers and reservoirs used for irrigation can be assessed for salinity and sodium hazards. Wilcox diagram were prepared using Grapher software.
4.Results & Discussion
- Groundwater Analysis
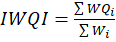
4.1.1 Wilcox Diagram Analysis- The Wilcox diagram (Figure 2) is used to assess groundwater suitability for irrigation by classifying water based on sodium absorption ratio (SAR), and electrical conductivity (EC). The diagram helps determine the potential for soil degradation due to sodium hazards and salinity risk. From the Wilcox diagram in the image, the groundwater samples (GW1-GW5) are categorized into different zones based on their EC and SAR values. On X axis electrical conductivity in µS/cm (salinity hazard) is represented. On Y axis sodium absorption ratio (SAR) as sodium hazard is represented. Color zones are as follows- S1 (Low SAR) is suitable for irrigation (Green zone). S2 (Medium SAR) is for slight to moderate risk (Yellow zone). S3 (High SAR) is unsuitable for irrigation without treatment (Orange zone). S4 (very high SAR) means severe sodicity risk not recommended for irrigation (Red zone). C1-C4 (salinity hazard zones) means higher C values indicate greater risk of soil salinization. Based on the Wilcox diagram placement of GW1-GW5 it may be concluded that most groundwater samples fall within low to medium salinity sodium hazards zones, suggesting they are suitable for irrigation with minimal risk. Some sites fall in the high salinity zones (C2, C3), indicating potential issues if used for irrigation without proper soil management and dilution strategies. GW1 appears to have a slightly higher SAR and EC, indicating increased risk of soil sodium accumulation, which can affect soil permeability. GW2, GW3 and GW5 fall in safe to moderate safe zones indicating good irrigation potential. G1 and G4 show higher salinity risks (C3), requiring dilution or improved soil management. Higher SAR values in some sites indicate potential sodium buildup, which can degrade soil structure over time. Water from low SAR and EC zones can be safely used for irrigation without major concerns. High EC (salinity) levels may affect plant growth due to osmotic stress. High SAR values indicate a need for calcium amendments, like Gypsum, to improve soil structure and prevent permeability loss. Most groundwater samples are suitable for irrigation, but GW1 and GW4 may require careful management to avoid soil salinity and sodium accumulation. The regular monitoring and proper soil amendments can help maintain soil health when using these groundwater sources for agriculture.
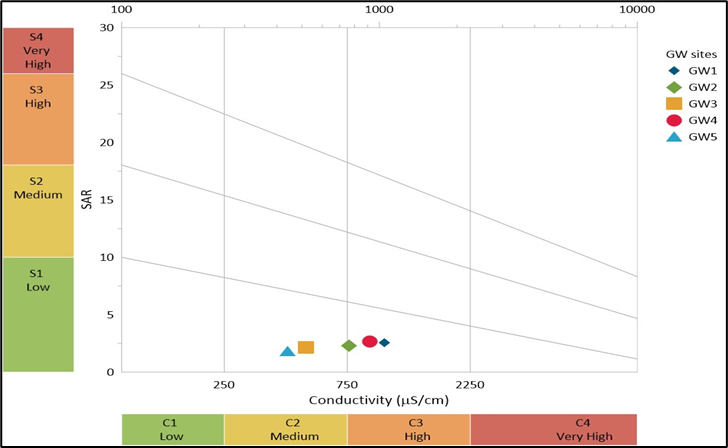
Figure 2. Wilcox diagram of with annual physicochemical average values all groundwater sites
- Irrigation Water Quality Analysis –
Table 1 shows the irrigation WQI values and related parameters like SAR, Kelly Index, Magnesium Hazard and Residual Sodium Carbonate of all groundwater sites. This table shows the status of groundwater for irrigation purpose. The information can be drawn conveniently.
Table 1. Irrigation water quality index and related parameters with their status of all groundwater sites
| S. No. | Site | EC | Status | KI | Status | MH | Status | RSC | Status | SAR | Status | IWQI | Status |
| 1 | GW1 | 1048.3 | Doubtful | 1.673 | Unsuitable | 28.875 | Suitable | -2.77 | Safe | 2.57 | Excellent | 27.086 | Good |
| 2 | GW2 | 763.83 | Doubtful | 1.891 | Unsuitable | 21.146 | Suitable | -1.43 | Safe | 2.3 | Excellent | 34.6 | Good |
| 3 | GW3 | 518.54 | Good | 2.486 | Unsuitable | 34.25 | Suitable | -1.16 | Safe | 2.16 | Excellent | 44.936 | Good |
| 4 | GW4 | 915.29 | Doubtful | 2.02 | Unsuitable | 27.984 | Suitable | -1.64 | Safe | 2.69 | Excellent | 39.343 | Good |
| 5 | GW5 | 439.44 | Good | 1.776 | Unsuitable | 28.252 | Suitable | -1.33 | Safe | 1.85 | Excellent | 30.762 | Good |
- Surface water
4.2.1 Wilcox Diagram Analysis – The Wilcox diagram (Figure 3) is used to assess the suitability of water for irrigation by plotting sodium absorption ratio (SAR) versus electrical conductivity (EC). This helps evaluate the potential for sodium hazards and salinity effects on soil structure and crop growth. On X axis EC in µS/cm is represented that measures salinity hazard. Higher EC means higher salinity which can affect plant growth. On Y axis SAR is represented that indicates sodium hazard. Higher SAR values suggest increased risk of sodium accumulation in soil, which can degrade soil structure. SW1 (Blue marker) falls in the C1-S1 and C2-S1 category (Low salinity and low sodium hazard) indicating excellent suitability for irrigation. SW2 (Green marker) lies in the C2-S1range (Medium salinity and low sodium hazard), which is acceptable but may require moderate leaching for some sensitive. SW3 (Yellow marker) is positioned in C2-S1 (Low salinity and low sodium hazard), meaning the water may need special soil management practices. SW4 (Red marker) falls in the C2-S1 (Medium salinity and low sodium hazard), making it slightly unsuitable for irrigation without significant treatment or dilution. SW1 is the best quality water for irrigation with minimal management required. SW2 and SW3 are still suitable, but continuous monitoring is needed to avoid long term salt accumulation. SW4 are of concern requiring dilution or gypsum amendments to prevent soil degradation due to sodium buildup. The Wilcox diagram suggests that SW1, SW2, and SW3 are good for irrigation, while SW4 require management practices to mitigate salinity and sodium hazards if these waters are used for agriculture, soil amendments and periodic water testing are essential.
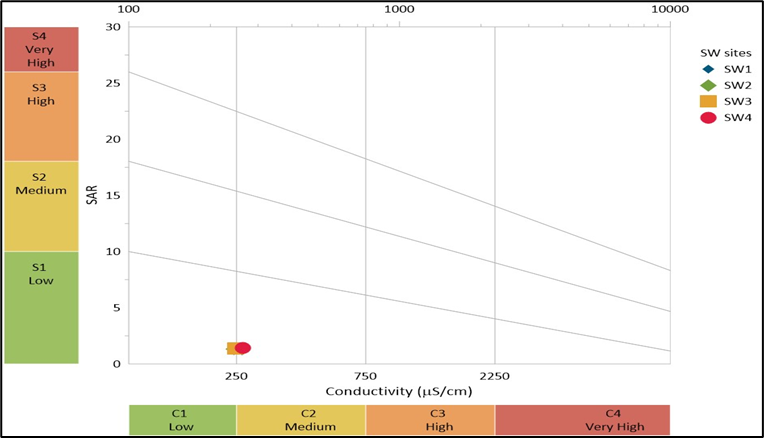
Figure 3. Wilcox diagram with annual physicochemical average values of all surface water sites
- Irrigation water Quality Assessment-
The Table 2 shows the irrigation WQI values with related parameters and their status of all surface water sites. The information can be drawn from the table.
Table 2. Irrigation water quality index and related parameters with their status of all surface water sites
| S. No. | Site | EC | Status | KI | Status | MH | Status | RSC | Status | SAR | Status | IWQI | Status |
| 1 | SW1 | 261.495 | Good | 1.347 | Unsuitable | 28.679 | Suitable | -0.95 | Safe | 1.174 | Excellent | 24.222 | Excellent |
| 2 | SW2 | 243.927 | Excellent | 1.802 | Unsuitable | 37.293 | Suitable | -0.5 | Safe | 1.342 | Excellent | 36.427 | Good |
| 3 | SW3 | 247.87 | Excellent | 1.711 | Unsuitable | 29.844 | Suitable | -0.57 | Safe | 1.382 | Excellent | 32.85 | Good |
| 4 | SW4 | 263.792 | Good | 1.838 | Unsuitable | 31.395 | Suitable | -0.48 | Safe | 1.431 | Excellent | 36.02 | Good |
4.3 Dendogram Clusturing Analysis-
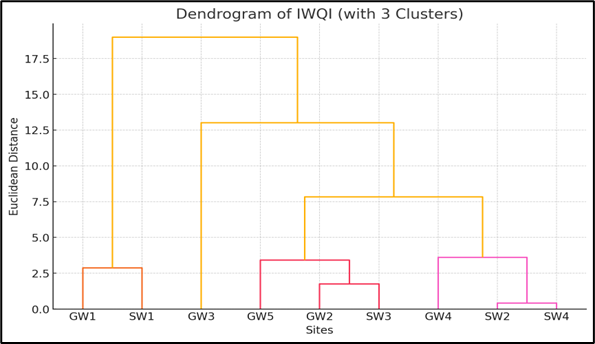
Figure 4. Dendogram of hierarchical clusturing of IWQI of all water sites
The dendrogram (Figure 4) shows each leaf at the bottom represents one site (GW1, SW1, etc.). The sites that are similar in IWQI are joined together first (lower height). The vertical lines (the branches) show how much distance/difference there is between sites or groups. The higher the branch connects, the more different the sites are. GW1 and SW1 are very similar. They joined very low, meaning their IWQI values are close. The GW2, GW5, and SW3 are also similar. They are clustered together at a relatively low distance. The SW2 and SW4 form another group. Their IWQI values are almost identical. The GW3 and GW4 are a bit more different from others but still grouped later. At a higher level, you can see two big groups (GW1, SW1) and (GW2, SW3, GW5, GW4, SW2, SW4, GW3). Similar IWQI sites likely have similar water quality may be similar pollution sources, land use, or hydrology. The GW1 and SW1 may be influenced by the same conditions (even though one is groundwater and one is surface water). GW3 (the highest WQI) is more different, so its water quality might be worse than others and investigation needed. Clustered sites can be treated or managed together for water quality improvement. Clusters show how surface water and groundwater in some areas are quite related (e.g., GW1 and SW1 are clustered). The Table 3 shows the irrigation WQI values with related parameters and their status of all surface water sites. The information can be drawn from the table.
Table 3. Irrigation water quality index and related parameters with their status of all surface water sites
| S. No. | Site | EC | Status | KI | Status | MH | Status | RSC | Status | SAR | Status | IWQI | Status |
| 1 | SW1 | 261.495 | Good | 1.347 | Unsuitable | 28.679 | Suitable | -0.95 | Safe | 1.174 | Excellent | 24.222 | Excellent |
| 2 | SW2 | 243.927 | Excellent | 1.802 | Unsuitable | 37.293 | Suitable | -0.5 | Safe | 1.342 | Excellent | 36.427 | Good |
| 3 | SW3 | 247.87 | Excellent | 1.711 | Unsuitable | 29.844 | Suitable | -0.57 | Safe | 1.382 | Excellent | 32.85 | Good |
| 4 | SW4 | 263.792 | Good | 1.838 | Unsuitable | 31.395 | Suitable | -0.48 | Safe | 1.431 | Excellent | 36.02 | Good |
6.Conclusions
This post monsoon assessment framework (field sampling + APHA lab methods + IWQI and classical indices) provides a practical approach to evaluate irrigation suitability of mixed water sources in Bhopal. Preliminary classification indicates that groundwater sources are suitable with low sodicity; some surface waters show elevated EC/Na and require management. Regular monitoring and targeted remediation (blending/leaching/soil amendments) are recommended to prevent long term soil degradation and secure agricultural productivity. The IWQI values (27.086 to 44.936) of all groundwater sites inform that the water is in good status for irrigation purposes. The highest IWQI (44.936) of GW3 (Chhawani Pathar)) tells water is better for irrigation purpose due to excellent status of SAR and safe values of RSC. The status of MH, RSC, and SAR values is suitable, safe and excellent respectively explaining no risk of high magnesium and sodium in groundwater sites. Wilcox diagram suggests that most groundwater samples are suitable for irrigation, but GW1 and GW4 may require careful management to avoid soil salinity and sodium accumulation. The IWQI values (24.222 to 36.427) suggest that all surface water sites have good water qualities for irrigation purposes. The SW1 site has greatest IWQI value (24.222) of excellent status among all. The EC status is excellent for SW2 and SW3 and good for SW1 and SW4 from the irrigation point of view. The MH status is suitable at all surface water sites. The RSC status is safe and SAR is excellent for all sites indicating no risk of Mg and Na for irrigation water. The Wilcox diagram suggests that SW1, SW2, and SW3 are good for irrigation, while SW4 require management practices to mitigate salinity and sodium hazards if these waters are used for agriculture, soil amendments, and periodic water testing are essential.
Acknowledgements
Authors acknowledge the support given by the laboratory of the Public Health Engineering Department of Bhopal, during the investigation
References
- Akhtar N, Syakir Ishak, M.I., Bhawani, S.A., and Umar, K. (2021). “Various natural and anthropogenic factors responsible for water quality degradation: A review”. Water., 13(19): 2660. https://doi.org/10.3390/w 13192660
- Elsayed, S., and Eid, M.H. et al. (2023). “Application of Water Quality Indices, Machine Learning Approaches, and GIS to Identify Groundwater Quality for Irrigation Purposes: A Case Study of Sahara Aquifer, Doucen Plain, Algeria”. Water, 15, 289. [Google Scholar] [CrossRef]
- Carpenter, S., Bhawsar, A., and Bhat, M. A. (2018). “Comparative study of physicochemical characteristics of ground water and surface water in Bhopal, India”, Inter. Jour. of Cur. Res. in Life Sci., 7 (2), 923–926. t http://www.ijcrls.com
- Silawat, R., and Chouhan, R. (2021). “Analysis of the Water Quality of the River Kaliasote, Bhopal (MP), India”, J. of Sci. & Tech. Res., 3(1), https://doi.org/ 10.51514 /JSTR.3.1.2021. 30-33
- Choudhary, R., and Rawtani, P. M. (2014). “Physicochemical and bacteriological assessment of the water quality of Kaliasote dam in Bhopal, MP”, J. of Acad. and Indus. Res., 3(1), 48–52. jairjp.com
- Shukla, R., Bhawsar, A., Tamot, P., and Sharma, S. (2023). “Assessment of fish biodiversity in relation to physicochemical characteristics of the Kolar River, MP, India”, Inter. Jour. of Fish. & Aqua. Stud., 11(2), 96–100. https://doi.org/10.22271 /fish.2023.v11.i2b.2793
- Jain, R. K., Jais, G. K., Saxena, A., Upadhyay, N., Shukla, R., and Shrivastava, P. K. (2012). “Potentiality of Kolar dam water for drinking purposes”, Food Sci. & Qua. Manag. 3, 18–22.http://www.iiste.org
- APHA Standards Methods for the Examination of Water and Wastewater, 23rd Edition, (2017).
- WHO Guidelines for Drinking Water Quality, Fourth Edition, incorporating the Ist and IInd Addenda (2022). https://creativecommons.org/licenses/by-nc-sa/3.0/igo).
- The BIS Bureau of Indian Standards specification for drinking water (BIS 10500:2012) was reaffirmed in February 2021. (2021). ielrc.org/content/e9110
- Apollaro, C., Fuoco, I., Bloise, L., Calabrese, E., Marini, L., Vespasiano, G., Muto, F. (2021). “Geochemical modeling of water-rock interaction processes in the Pollino National Park”. Geofluids 2021, 1–17. [Google Scholar] [CrossRef]
- Batarseh, M., Imreizeeq, E., Tilev, S., Al Alaween, M., Suleiman, W., Al Remeithi, A.M., Al Tamimi, M.K., and Al Alawneh, M. (2021). “Assessment of groundwater quality for irrigation in the arid regions using irrigation water quality index (IWQI) and GIS-Zoning maps: Case study from Abu Dhabi Emirate, UAE”. Groundw. Sustain. Dev., 14, 100611. [Google Scholar] [CrossRef]
- Das, A. (2025). “Assessment of Surface Water Quality Modelling for Drinking Purposes in Brahmani River Basin (BRB), Odisha, Using Geographical Information System (GIS), IDOCRIW (I) and COPRAS (Ui) Techniques”. In: Pal, S.C., Chatterjee, U. (eds) Surface, Sub-Surface Hydrology and Management. Springer Geography. Springer, Cham. https://doi.org/10.1007/978-3-031-62376-9_9
- Khan, S., Shehwaz, M., Jehan, N., Rehman, S., Khan, M. T., and Islamuddin (2013). “Drinking water quality and human health risk in Charsadda district, Pakistan”, J. of Cleaner Prod., 60, 93–101. doi:10.1016/j.jclepro.2012.02.016
- Ibn Ali, Z., Abidi, M. and Zairi, M. (2025). “Groundwater quality assessment for drinking and irrigation purposes by utilizing integrated water quality indexes in a semi-arid region, SE Sfax area, Tunisia”. Euro-Mediterr J Environ Integr 10, 689–701. https://doi.org/10.1007/s41207-024-00610-3
- Gerten, D., Heck, V., Jägermeyr, J., Bodirsky, B.L., Fetzer, I., Jalava, M., Kummu, M., Lucht, W., Rockström, J., and Schaphoff, S. (2020). “Feeding ten billion people is possible within four terrestrial planetary boundaries”. Nat. Sustain., 3, 200–208. [Google Scholar] [CrossRef]
- Alqarawy, A., El Osta, M., Masoud, M., Elsayed, S., and Gad, M. (2022). “Use of Hyperspectral Reflectance and Water Quality Indices to Assess Groundwater Quality for Drinking in Arid Regions, Saudi Arabia”. Water, 14, 2311. [Google Scholar] [CrossRef]
- El Bilali, A., and Taleb, A. (2020). “Prediction of irrigation water quality parameters using machine learning models in a semi-arid environment”. J. Saudi Soc. Agric. Sci., 19, 439–451. [Google Scholar] [CrossRef]
- Ji, Y., Wu, J., and Wang, Y. (2020). “Seasonal variation of drinking water quality and human health risk assessment in Hancheng city of Guanzhong Plain, China”, Expo. & Health. https://doi.org/10.1007/s12403-020-00357-6
- Khadr, M., Gad, M., El-Hendawy, S., Al-Suhaibani, N., Dewir, Y.H., Tahir, M.U., Mubushar, M., and Elsayed, S. (2020). “The Integration of Multivariate Statistical Approaches, Hyperspectral Reflectance, and Data-Driven Modeling for Assessing the Quality and Suitability of Groundwater for Irrigation”. Water, 13, 35. [Google Scholar] [CrossRef]