
- Introduction
- Dyeing is an important process that imparts color to materials, enhancing the appearance and aesthetic value of the desired products. The earliest known use of an organic colorant, blue indigo, was discovered in the wrappings of mummies in Egyptian tombs dating back 4,000 years [1]. Currently, several thousand commercial dyes are available on the market, and over 7,101 tons of dyestuffs are produced annually worldwide [2]. These dyes are extensively used across various industries such as textiles, food, cosmetics, paper printing, and leather processing.
- However, these industries release large quantities of wastewater containing unfixed dyes into water bodies, which poses serious risks to both human health and the environment [3]. Some dyes, such as azo dyes, are toxic and carcinogenic. They can enter the human body through ingestion and may be metabolized by intestinal microorganisms into compounds capable of causing DNA damage. Furthermore, many dyes are non-biodegradable and can persist in surface waters, traveling long distances and affecting ecosystems.
4. Colored wastewater often contains harmful dyes that threaten plants, aquatic life, and the overall ecological balance. Among these, methylene blue (MB) is a widely used coloring agent in various industries.
Methylene blue (MB) is a cationic dye and it is very difficult to decolorize due to complex structure and chemical properties that shown in fig.1 [4]. It has some harmful effects on animal and the human body. MB can be reason of eye burns due to contact with eye and it may be liable for permanent injury to the eyes of animals and human [5].
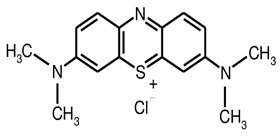
Figure 1: Methylene Blue Chemical Structure
Profound exposure to MB may cause enhanced vomiting, shock, heart rate, Heinz body formation, cyanosis and tissue necrosis in humans [6]. It is very necessary to reduce this dye content from wastewater which leads to a good environment for our ecosystem. In the past decades, serious research efforts on how to efficiently remove dyes from industrial effluents have resulted in the investigations of methods such as adsorption, advanced oxidation, and membrane separations [7-8]. Reports have shown that these techniques proved to be effective and displayed a varying degree of dye removal from the industrial wastewater [8-9]. In present days, the adsorption technique is widely used to reduce the dye. In term of simplicity, effectiveness and low cost adsorption has great advantages compared to other conventional methods [10]. There are various types of adsorbent available under natural and chemical adsorbent to conduct the technique in which many adsorbents are cheaper and more easily available.
The superiority and efficiency of adsorption techniques are primarily relying on the possible harmless of the treated water [11]. The performance of removal efficiency is directly dependent on the cost and quality of the adsorbents, last few decades it was noticed that numerous adsorbent have developed in various forms such as activated carbon [12], carbon nanotubes, zeolites [13], clay and minerals [14], chitosan [15], lignocelluloses [16], natural minerals [17], functionalized polymers [18], coal fly ash, sewage sludge, biomass and agriculture waste. Moreover, the use of tea waste is potential low cost adsorbents for the removal of colors substances from wastewater. Tea is considered as one of the most popular beverage items and approximately 3.5 million tons of tea was consumed every year in the world [19]. In 2017, Bangladesh produced a total of 78.95 million kg tea in which most of it is consumed by its people and so TW is much more available.
In this study, TW has been taken as an adsorbent for the removal of model dye MB. Tea waste is cost effective and less biodegradable. Therefore, the effects of different doses, pH and contact time were investigated.
- Material and Methods
- Adsorbate
Methylene Blue purchased from Stahl Chemicals India Pvt Ltd. and used as an adsorbate. Chemical formula and molecular mass of MB is C16H18ClN3S and 319.85 g/mol respectively. The maximum wavelength of MB dye was to be found 670 nm and it is known strong adsorption onto solid.
2.2. Preparation of adsorbent
The spent tea bag was collected from nearby tea stall around Institute of Leather Engineering and Technology, University of Dhaka, Hazaribag, Dhaka-1209, Bangladesh. The spent tea leaves were then opened up and washed with distilled waters several times to remove all unwanted dust substances. Then the tea waste was spontaneously boiled with clean water for removing caffeine, tannin and washed until contains no colors on washing water. The washed tea wastes were then dried at 95 0C for 6 hours. The dried tea waste materials were then crushed and sieved to get a particular smaller size range 0.5-1.0 mm and stored for uses.
- Chemicals
The solution was made by adding 3g of MB in 1L of distilled water. This was done to get the desired concentration. It is essential to adjust the pH of the solution due to conduct the test at different pH. Analytical grade dilutes HCl and NaOH were used for this adjustment.
- Effect of adsorbent dose
The effect of adsorbent dose on MB was experimented by adding various amounts (0.50, 0.60, 0.80, 1.2 and 1.5 g) of the spent tea leaves into a 250 mL conical flasks. The flask contained a definite volume (50 mL) of fixed initial concentration (30 ppm) of the dye solution at room temperature of (25±2) 0C and pH 4. The flasks were placed in a shaker to perform stirring for two hours.
- Effect of Solution pH
In this experiment, 50 mL of MB dye solution of 30 ppm initial concentration at various pH ranges from 2.0 to 13.0 was stirred with 0.7 g of STL in a water-bath shaker at room temperature for 2 hours. The concentrations of dye were determined by UV–vis spectroscopy. The pH value was adjusted with 0.1N NaOH and 0.1N HCl solutions and measured using a pH meter.
- Effect of Contact time
The model dye MB adsorbed by the adsorbent was studied at different contact. Here, a total of 0.7 g of adsorbent was added to 50 ml MB with a concentration of 30 ppm at definite pH 6.2 and temperature. The test was performed at different time categories according to 20, 40, 60, 80, 100 and 120 min.
- Removal Efficiency
As the test was done at different amount adsorbent doses, different pH value and time intervals, so it’s need to be calculated for removal efficiency. The dye removal percentage is carried out through this equation,Removal Efficiency ![]()
Here, Ci and Cfis the concentration of MB initial and final respectively.
- Analytical Method
The entire test has been carried out by UV vis spectrophotometer. Before doing the experiment, the MB solution sample was tested to obtain the molar absorptivity constant and calibration curve. This is accomplished with the equation of Beer-Lambert Law, A=ƐlC………………. (1)
Where A= Absorbance, Ɛ= Molar Absorptivity Constant, l= Path length and C= Concentration of the sample
All the absorbance values were taken at the maximum wavelength and a calibration curve was established using Excel software. To do this job, a concentration of 30, 40, 50, 60 and 70 ppm sample solution was taken into UV spectrometer. Then the resulted data was taken for the calculation.
- Results and Discussions
Figure 2 shows the calibration curve of Methylene Blue. At 30 ppm concentration, it gives highest absorbance value 2.82 at maximum wavelength 670 nm. After plotting the different concentration and absorbance value at a 670nm wavelength in the graph, we got linear tread line showing below figure. The calculated molar absorptivity constant, Ɛ was 3*104 Lmol-1cm-1

Figure 2: Methylene Blue Calibration Curve
3.1. Effect of TW adsorbent doses on MB dye adsorption
The effect of different adsorbent dose on the adsorption of MB was conducted at a different adsorbent dose ranging from 0.3 gm to 1 gm shown in table 1. The doses were added to 50 ml MB solution with a concentration of 30 ppm at pH4 and room temperature (25±2) for 2 hours.
Table1: Concentration of dye solutions at different adsorbent doses
| Sl. No. | Dose of Adsorbent (gm) | Conc. After treatment (ppm) |
| 01 | 0.30 | 1.52 |
| 02 | 0.40 | 1.19 |
| 03 | 0.50 | 0.95 |
| 04 | 0.60 | 0.83 |
| 05 | 0.70 | 0.64 |
| 06 | 0.80 | 0.66 |
| 07 | 0.90 | 0.76 |
| 08 | 01.0 | 0.79 |
Figure 3 show that removal efficiency increases with at certain doses 0.7 gm. After that, it was not increasing the efficiency. At 0.3 gm doses of adsorbent, it gave removal efficiency of 94.93%. On the other hand, the maximum removal efficiency was found on the addition of 0.7 gm doses as shown in the figure.

Figure 3: Removal efficiency percentage at different doses.
3.2. Effect of pH on MB dye absorption
Table 2 shows the concentration after adding 0.7 gm adsorbent at different PH. The effect of PH was studied in both acidic and basic condition ranging from 2 to 12.
Table 2: Concentration of solution at different pH after addition of doses
| Sl. No. | Solution pH | Conc. After treatment (ppm) |
| 01 | 2 | 0.92 |
| 02 | 3 | 0.79 |
| 03 | 4 | 0.64 |
| 04 | 5 | 0.77 |
| 05 | 6 | 1.03 |
| 06 | 8 | 1.04 |
| 07 | 10 | 1.07 |
| 08 | 12 | 1.13 |
Figure 4 shows a different percentage of dye removal at different pH. At pH 2, it gave removal efficiency of about 96.93%. After that, it removed maximum dye at pH 4 in which removal efficiency was 97.87%. Then it is noticeable from the graph the removal efficiency percentage decreases with the increase of pH.

Figure 4: Removal efficiency percentage at different pH
- Effect of Contact time on MB dye adsorption
The effect of contact time on the removal of model dye MB was studied in different time duration. Table 3 shows the concentration of MB after treating with the adsorbent at the time ranging from 20 to 160 minutes.
Table 3: Concentration of dye solution at the different time duration
| Sl. No. | Time (min) | Conc. after treatment (ppm) |
| 01 | 20 | 1.23 |
| 02 | 40 | 0.95 |
| 03 | 60 | 0.91 |
| 04 | 90 | 0.89 |
| 05 | 100 | 0.80 |
| 06 | 120 | 0.64 |
| 07 | 140 | 0.68 |
| 08 | 160 | 0.69 |
Figure 5 shows that the percentage of removal efficiency maximum when the testing time 120 min. After 20 min, its removal efficiency was found t 95.9%. After 120 min the percentage of removal efficiency decreases with time.

Figure 5: Percentage of removal efficiency at different pH
- Conclusion
Spent tea leaves are very low cost and easily available material which can be used as an excellent adsorbent for the removal of Methylene Blue. Though it does not remove 100% dye from solution, it goes near to 100% which can be considered as good adsorbent as compared to other adsorbents. The percentage of dye removal efficiency was found to vary with adsorbent dose, pH and contact time. Moreover, the Tea waste adsorbent is expected to be more economically feasible for the removal of model dye MB from color solutions.
Conflict of Interest: Authors declare that they have no conflict of interest.
References
- Berton, G.; Gordon, S.;Immunology.1983,49, 705
- Silveira, E.; Marques, PP.; Silva, S. S.; Lima-Filho, J. L.; Porto, A.; Tambourgi, E.;2009
- Hwang, M.; Chen, K.;1993 J. Appl. Polym. Sc. 49, 975–989
- Liu, T. H.; Li, Y. H.; Du, Q. J.; Sun, J. K.; Jiao, Y. Q.; Yang, G. M.; Wang,Z. H.;Xia, Y. Z.; Zhang, W.; Wang, K. L.; Zhu, H. W.; Wu, D. H.;Colloids Surf. B.2012, 90,197–203
- Pirbazari, A. E.; Pargami, N. R.; Ashja, N.; Emami, M. S.;J Environ Anal Toxicol,2015,5(5)
- Kumar, K. V.; Ramamurthi, V.; Sivanesan, S.;J Colloid Interf Sci.,2005, 284, 14-21
- Ahmad, A.;Mohd-Setapar, S. H.; Chuong, C. S.; Khatoon, A.; Wani, W. A.; Kumar, R.; Rafatullah, M.;RSC Advances,2015, 5(39), 30801-30818
- Kyzas, G. Z.;Siafaka, P. I.; Pavlidou, E. G.; Chrissafis, K. J.; Bikiaris, D. N.;2015,Chemical Engineering Journal,259, 438-448
- Yagub, M.T.; Sen, T. K.; Afroze, S.; Ang, H. M.;Advances in colloid and interface science,2014, 209, 172-184
- Alouani, M. E. L.; Alehyen, S.; Achouri, M. E. L.; Taibi, M. E. L.; J. Mater. Environ. Sci.,2018, 9(1), 32-46
- Moussavi, G.; Mahmoudi, M.;J Hazard Mater,2009, 168, 806-812
- Christie, R. M.; Environmental Aspects of Textile Dyeing, Woodhead, Boca Raton, Cambridge, England, 2007
- Nabil, G. M.; El-Mallah, N. M.; Mahmoud, M. E.; J Industrial and EngChem, 2014, 20, 994-1002
- Kumar. K. V.; Ramamurthi, V.; Sivanesan, S.;J Colloid InterfSci,2005, 284, 14-21
- Al-Degs, Y.; Khraisheh, M. A. M.; Allen, S. J.; Ahmad, M. N. A.;Sep SciTechnol,2001, 36, 91-102
- Mahmoud, M. E.; Al-Bishri, H. M.; ChemEng J.2011, 166, 157-167
- Shafeeyan, M. S.; AshriWanDaud, W. M.; Houshmand, A. H.; Shamiri, A.;2010, 89, 143-151
- Panuccio, M. R.; Sorgonà, A.; Rizzo, M.; Cacco, G.; J Environ Manage2009, 90, 364-374
- Boonamnuay, V.; Chaiya, C.;Tanthapanichakoon, W.;Jarudilokkul, S.; Sep. Purif. Technol. 2004, 35, 11–2