
Introduction: Air is one of the fundamental requirements for sustaining life. The atmosphere is generally divided into outdoor air and indoor air. Indoor air quality has a significant impact on human health, as nearly 90% of human activities take place indoors.¹
Healthy indoor air quality is characterized by the absence of pathogenic microorganisms such as bacteria and fungi (ideally ~0 CFU/m³).² The Indonesian government has set the maximum permissible concentration for microorganisms in indoor air at 0 CFU/m³ for bacteria and 1000 CFU/m³ for fungi.³
Excessive concentrations of microorganisms in indoor environments can lead to Sick Building Syndrome (SBS).⁴˒⁵ SBS arises from substandard indoor air quality and is defined as a set of symptoms experienced by building occupants, including skin allergies, respiratory difficulties, eye and nasal irritation, dryness of the mucous membranes, mental fatigue, headaches, acute respiratory infections, asthma, coughing, sneezing, flu-like symptoms, and other hypersensitivity reactions.²˒⁴
According to the National Institute of Occupational Safety and Health (NIOSH, 1997), poor indoor air quality is generally caused by several factors: insufficient ventilation (52%), indoor contaminants (16%), outdoor contaminants (10%), microbes (5%), building materials (4%), and other causes (13%).⁶ Improving air quality can be achieved through regular air exchange, specifically by: (1) designing homes with ventilation openings larger than 10% of the floor area using a cross-ventilation system, (2) maintaining devices and opening windows at least once daily in air-conditioned rooms, (3) installing and using exhaust fans, and (4) managing room layout.⁷
In this study, we investigate the use of exhaust fans to improve indoor air quality in air-conditioned rooms. The exhaust fan reduces bacterial and fungal concentrations by facilitating air exchange. The objective is to determine the optimal operating time of the exhaust fan required to achieve acceptable air quality.
MATERIALS AND METHODS
This study employed a quasi-experimental design with non-randomized repeated trials. The research population consisted of air-conditioned classrooms at Campus A of the Health Polytechnic, Ministry of Health, Pontianak. Four classrooms equipped with exhaust fans (airflow capacity ~1728 CMH) were selected. According to Federer’s formula, each experiment was repeated six times. The exhaust fan operating times were varied at 30, 60, 90, and 120 minutes. Bacterial and fungal concentrations were measured both before and after exhaust fan operation.
Sampling was conducted using petri dishes containing NA (Nutrient Agar) for bacteria and PDA (Potato Dextrose Agar) for fungi. Placement followed the Indonesian National Standard (SNI 7230:2009). Specifically, in small rooms (length and width <6 m), petri dishes were positioned at five points: four along the diagonal midpoints and one at the central intersection.⁸ After 30 minutes of exposure, the petri dishes were collected, incubated, and analyzed in the laboratory following standardized procedures for microbial culture and colony enumeration.
Laboratory personnel carried out the calculations, and results were officially documented. Colony-forming units (CFU) were determined according to the Polish Standard PN 89/Z-04008/08 using the following formula:⁹
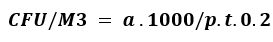
With ‘a’ is many colonies in Petri dishes, ‘p’ is a surface area of a petri dish, and ‘t’ is Petri dishes exposing time.
Research also measurements: temperature, humidity, and light intensity. Data analyzed by univariate, i.e., the percentage decreased in bacterial and fungal levels before and after the exhaust fan running for 30, 60, 90, and 120 minutes.
The multivariate-analysis performed by the Manova.
To know the presence of the effect in the variations exhaust fan running time on the numbers of bacterial and fungal colonies.
RESULTS AND DISCUSSION
Levels of bacteria and fungi in the classroom by turning on the Exhaust Fan seen in the table. The average value of bacterial and fungal colonies for each treatment obtained from 6 experiment repetitions.
Table 1. Bacterial and fungal concentration result
| Running time (min) | Average bacterial concentration (CFU/M3) | Shift | Average fungal concentration (CFU/M3) | Shift | ||
| PRE | POST | PRE | POST | |||
| 30 | 1.756,53 | 1.493,01 | -261,51 | 1.009,67 | 548,35 | -461,32 |
| 60 | 2.167,44 | 1.760,37 | -407,07 | 667,67 | 802,08 | +134,20 |
| 90 | 1.328,41 | 812,56 | -515,84 | 363,82 | 382,69 | +18,87 |
| 120 | 972,98 | 712,96 | -260,02 | 456,08 | 310,35 | -145,74 |
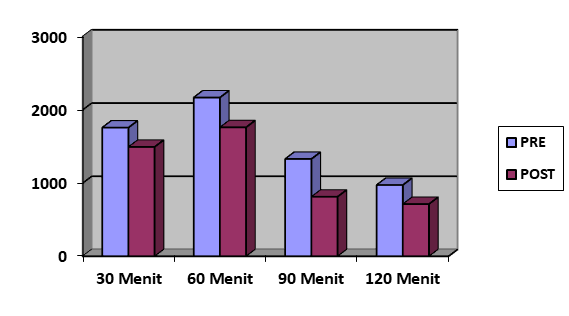
Figure 1. Average bacteria concentration at pre and post exhaust fan running

Figure 2. Average fungal concentration at pre and post exhaust fan running
After 30 minutes of running the exhaust fan, bacterial and fungal concentrations decreased by 261.51 and 461.32 CFU/m³, respectively. At 60 minutes, the bacterial concentration decreased by 407.07 CFU/m³, while the fungal concentration increased by 134.20 CFU/m³. After 90 minutes of operation, bacterial levels decreased further by 515.84 CFU/m³, whereas fungal levels slightly increased by 18.87 CFU/m³. Following 120 minutes of running the exhaust fan, decreases of 260.02 and 145.74 CFU/m³ were observed for bacterial and fungal concentrations, respectively.
These results indicate that bacterial concentrations remained slightly above the threshold level (>700 CFU/m³), reaching 712.96 CFU/m³ after 120 minutes of exhaust fan operation. The most significant reduction in bacterial concentration occurred after 90 minutes, while fungal levels showed the greatest decrease after just 30 minutes of fan operation.
Prior to the MANOVA analysis, homogeneity was confirmed using Levene’s test, with significance values greater than 0.05. Consequently, Bonferroni’s method was applied as a post hoc test, allowing determination of whether the exhaust fan significantly reduced bacterial and fungal concentrations in the air.
Table 2. Effect of post-treatment (different from exhaust fan running time) on the bacterial and fungal concentration
| Variable | Sig.-Values in bacterial concentration | Sig.-Values in fungal level |
| Different exhaust fan running time | 0,000 | 0,023 |
Table 2 shows that the bacterial and fungal concentration was significantly affected by running the exhaust fan, with both sig. value (0.000 and 0.023, respectively) demonstrate the value below 0.05.
We observed no significant variation in bacterial and fungal concentrations in the classroom before running the exhaust fan, as the room conditions were controlled during the experiment. The classroom was maintained with an 18,000 BTU air conditioner, temperature of 26–28 °C, humidity of 70.16–75.81%, light intensity of 175.10–177.34 Lux, and 36–44 occupants.
After operating the exhaust fan for varying durations, notable reductions in bacterial and fungal concentrations were observed, indicating the effectiveness of the exhaust fan in improving indoor air quality. However, the extent of reduction varied with the fan running time due to differences in ventilation conditions and room occupancy, consistent with previous studies by Hayleeyesus (2014), Wamedo (2012), and Graudenz (2005).
Interestingly, fungal concentration showed inconsistencies between 30 and 120 minutes of exhaust fan operation: the fungal reduction after 30 minutes was greater than after 120 minutes. Moreover, fungal levels increased after 60 and 90 minutes, likely due to occupant activity, such as opening doors. Ponce-Caballero (2013) demonstrated that outdoor fungal levels significantly affect indoor concentrations, as fungi can enter through open windows or doors, causing fluctuations. Similarly, Adams (2015) emphasized that room occupancy is a key factor influencing indoor microorganism levels, especially in poorly ventilated spaces.
For bacterial concentrations, significant differences were observed between various exhaust fan running times: 30 vs. 90 min (p = 0.040), 30 vs. 120 min (p = 0.015), 60 vs. 90 min (p = 0.003), and 60 vs. 120 min (p = 0.001). For fungal concentrations, a significant difference was noted between 60 and 120 min of operation (p = 0.030).
The bacterial concentration threshold was set at 700 CFU/m³. Although the exhaust fan operated for 30, 60, and 90 minutes, bacterial levels remained above this threshold. Only after 120 minutes did the bacterial concentration approach the threshold, suggesting that exhaust fan usage alone could not fully reduce bacterial levels below the limit, likely due to human activity and occupancy, as reported by Fox (2013), Mahyuddin (2013), and Meadow (2014). CO₂ levels were also found to correlate with microorganism concentrations. While outdoor air quality had an effect, human presence contributed nearly twice as much to indoor microorganism levels.
For fungi, the threshold was set at 1000 CFU/m³. Running the exhaust fan for 30–120 minutes successfully reduced fungal concentrations below this limit, demonstrating that only 30 minutes of operation was sufficient to achieve acceptable indoor fungal levels. Previous studies by Barberan (2015) and Adams (2013) also showed lower mold levels indoors compared to outdoors. Goh (2000) reported that indoor mold in Singapore libraries was approximately 50 times lower than outdoor levels.
Conclusion
This study demonstrates that a simple exhaust fan can effectively improve indoor air quality by reducing bacterial and fungal concentrations. Statistically significant reductions were observed, with p-values of 0.000 for bacteria and 0.023 for fungi. To bring bacterial levels near the threshold, 120 minutes of exhaust fan operation was required, while reducing fungal levels below the threshold required only 30 minutes.
References
- Laila Fitria, et al. Air Quality in “X” University Library Room Judging From Biology, Physical and Chemistry Kaulitas. Makara Journal, Health. December 2008; 12 (2): 76-82.
- Sedyaningsih, E. R. Guidelines for air sanitation in the home space. Jakarta, 2011.
- RI Ministry of Health. RI Minister of Health Regulation No. 48 of 2016 concerning Office Occupational Safety and Health Standards. RI Ministry of Health: Jakarta, 2016.
- Ahearn D., Armour, S. & Banta, J. Guidelines on assessment and remediation of ka pang in indoor environments. Department of Health and Mental Hygiene: New York, 2008.
- Heseltine, E.& Rosen, J. WHO guidelines for indoor air quality: dampness and mold. World Health Organization: Europe, 2009.
- MOH RI. RI Minister of Health Decree No. 1407 / Menkes / SK / XI / 2002 concerning Guidelines for Controlling the Impact of Air Pollution. MOH, RI: Jakarta, 2002.
- RI Ministry of Health. RI Minister of Health Regulation No. 1077 / Menkes / Per / V / 2011 concerning Guidelines for Indoor Air Sanitation. RI Ministry of Health: Jakarta, 2011.
- National Standardization Agency. A technique for Determining Air Sampling Points at Work. BSN: Jakarta, 2009.
- Stryjakowska-Sekulska, M et al. Microbiological Quality of Indoor Air in University Rooms. Polish Journal of Environments Study. 2007;16: 623-632
- Hayleeyesus, S. F., & Manaye, A. M. Microbiological quality of indoor air in university libraries. Asian Pac J Trop Biomed. 2014;4(1):S312-7.
- Wamedo SA, Ede PN, Chuku A. Interaction between building design and indoor airborne microbial load in Nigeria. Asian J Biol Sci. 2012;5:183–191.
- Graudenz GS, Oliveira CH, Tribes A, Mendes C Jr, Latorre MR, Kalil J. Association of air-conditioning with respiratory symptoms in office workers in a tropical climate. Indoor Air. 2005 Feb;15(1):62-6.
- Ponce-Caballero C, Gamboa-Marrufo M, Lopez-Pacheco M, Ceron-Palma I, Quintal-Franco C, Giacoman-Vallejos G, Loria-Arcila JH. Seasonal variation of airborne fungal propagules indoor and outdoor of domestic environments in Merida, Mexico. Atmosfera. 2013;26(3):369-377.
- Adams RI, Bhangar S, Pasut W, Arens EA, Taylor JW, Lindow SE, et al.Chamber bioaerosol study: outdoor air and human occupants as sources of indoor airborne microbes. PLoS One. 2015;10:e0128022.
- Fox A, Harley W, Feigley C, Salzberg D, Sebastian A, Larsson L. Increased levels of bacterial markers and CO2 in occupied school rooms. Journal of Environmental Monitoring. 2003;5(2):246-252
- Mahyuddin N, Awabi HB, Alshitawi M. The spatial distribution of carbon dioxide in rooms with particular application to classrooms. Indoor and Built Environment. 2014;23(3):433-448.
- Meadow JF, Altrichter AE, Kembel SW, Kline J, Mhuireach G, Moriyama M, et al. Indoor airborne bacterial communities influenced by ventilation, occupancy, and out outside air source. Indoor air. 2014;24(1):41-48.
- Barberan A, Dunn RR, Reich BJ, Pacifici K, Laber EB, Menninger HL, et al. The ecology of microscopic life in household dust. Proc R Soc B. 2015;282:2015;1139.
- Adams RI, Miletto M, Taylor JW, Bruns TD. Dispersal in microbes: fungi in indoor air are dominated by outdoor air and show dispersal limitation at short distances. ISME J. 2013;7:1262–73.
- Goh I, Obbard J, Viswanathan S, Huang Y. Airborne bacteria and fungal spores in the indoor environment. A case study in Singapore. Acta Biotechnol. 2000;20:67–73.