
Introduction
Polycyclic aromatic hydrocarbons (PAHs) are a class of diverse organic compounds containing two or more fused aromatic rings of carbon and hydrogen atoms. They are a class of priority pollutants, ubiquitous in the aquatic ecosystems, which show lipophilic character resistance to biodegradation and adverse health effects (carcinogenic activities) depending on the molecular weight of the structure (1). These compounds are generally generated by natural and anthropogenic processes and can be introduced into the environment through various routes. Contamination of the Suez Canal with hydrocarbons from petroleum sources has been considered. Knowing that water and sediment acts as repositories of pollutants, especially petroleum hydrocarbons, (2). The contamination levels were found due to petrogenic origin and their sources are either weathered or highly weathered crude oil and or used lubricating oil. Their detection gives an indication of recent and continuous petroleum inputs, (3).
Also, the pollution is mainly pyrolytic and related to anthropogenic as the samples collected in the two seasons (4). Estimated total inputs of 230000 metric tons of PAHs are released annually to the aquatic environment. So far, there is no indication that input into the environment as a result of human activity decreased substantially in the 1990 – 2000 decade. PAHs are of environmental
concerns due to their toxicity, mutagenic and carcinogenic potential,(5). Four to seven rings PAHs are highly mutagenic and carcinogenic, two or three rings are less mutagenic but can be highly toxic, they are organic contaminants in environments and belong to a class of organic pollutants. 16 of them have been identified and listed as priority pollutants by US environmental protection agency (US EPA and European Union). Using High performance Liquid chromatography (HPLC) was determined in water. The sources of PAHs contamination (pyrogenic and petrogenic) were achieved using both PAHs distribution and molecular indices based on ratios of selected PAH concentrations.
The contamination is shown to be either petrogenic and mixed petrogennic and pyrolytic, (6). PAHs with 2-3 rings generally of petrogenic origin, related to petroleum including crude oil and its refined products, (7). PAHs with 4-6 rings hydrocarbons are generally of pyrogenic origin and generated by the combustion of fossil fuels and of recent organic material. The 16 PAHs can be divided according to number of ring into low and high molecular weight PAHs, (8). The low molecular weights are those having two or three aromatic rings and are referred to 6LPAHs. The high molecular weight consists of tetra-penta and hexa aromatic rings. They are 10HPAHs, and divided into three groups according to their molecular weight, the 6 LPAHs (2+3), 4 Medium (M) PAHs (4rings) and 6 HPAHs (5+6) rings (9). The nomenclatures and abbreviations of the 16 PAHs are shown in Fig. 1. LPAHs cause a cute toxicity, the four rings PAHs have carcinogenic, mutagenic and geotaxis affects whereas some of the HPAHs are carcinogenic, (10, 11). The propose of the present study is to identify the level and distribution of petroleum hydrocarbons in studied area and also, to survey the major sources of PAHs and identify its, levels in addition to the distribution of individuals PAHs in order to establish up to date PAHs environmental monitoring. This would be a useful reference for future studies, Environmental management as well as protection and conservation programs of this area.
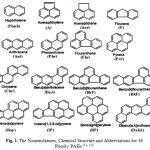 |
Figure 1: The Nomenclatures, Chemical Structure and Abbreviations for 16 Priority PAHs (11, 12) |
Materials and Methods
Materials
The reagents were all analytical reagent grade or chemically pure. All solvents were redistilled and dried before use by standard procedures (13). All the oils-extracted from surface water samples were analyzed according to the standard test method IP318/75 (13). The apparatus used was water HPLC 600, Auto Sampler 616 Plus, Dual Absorbance Detector 2487, attached to a computerized system with Millennium 32 Software (14).
Methods
Samples Locations
The locations in the present investigation includes (1&2) Attaqa power stations, (3& 4) Hard steal and moon beach (5& 6), Sewage company (7), Trust company for textile product food oil production Table 1.
Descriptions of the Locations
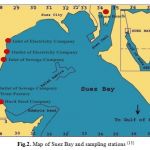
Attaqa power station company is located about 9 Km from Suez city at Attaqa region and was designed generate electric power, where the natural gas is used as fuel. This location include sampling from two sites, inlet of power station (1) which is located about 9 Km far from Suez city, and (2) outlet of power station which is located about 500 m far from inlet of the station. Hard steel company, site (3) is about 18 Km far from Suez city at Attaqa region and designed to produce hard steel and food oil (Afia oil, Rawaby butter) and use water to cooling the product and then drainage at the Gulf and probability to take some waste from products which make pollution in water. Moon beach is located about 18 Km east from Suez city and used to make recreation fun for humans and it must be free from all pollutions whether air or water pollution (15). The study on this site is important, in the determination of pollutions caused by loading and unloading of ships and oil spills from the ballast water and industrial waste, which threaten human health if we be direct contact with this water. Sewage domestic water is located about 14 km from Suez city at Attaqa region and designed to collection of domestic sewage. this location include sampling from two sites, inlet of plant station site (5) which is located about 14 km far from Suez city, and outlet of plant station which is located about 1 km from inlet of this station and trust company for textile product site (7) is located about 17 km from Suez city at Attaqa region and designed to production of textile soft or dry good, it take water from Suez bay to liberating free of cotton textiles from sodium hydroxide and the liberated liquid is drainages into the Gulf, Table 1& Fig. 2.
Table 1: Studied sites, their locations, activities and distance from Suez city
| Site No. | Location | Distance from Suez city: (Km) | Activities | |
| 1 | Inlet of Electricity Suez Company | 9 | Generation of electricity | |
| 2 | Outlet of Electricity Suez Company. | 11 | ||
| 3 | Hard steel Suez Company | 18W | Hard steal production. | |
| 4 | Moon Beach. | 18 E | Recreation fun | |
| 5 | Inlet of Attaqa Sewage Company | 14 | Treatment of domestic sewage | |
| 6 | Outlet of Attaqa Sewage Company | 15 | ||
| 7 | Trust Suez company | 17 | Textile production |
 |
Collection of waste water samples
The samples are collected seasonally from the different sites in the studied area as described in Table 1. The surface wastewater (0-2cm) samples were taken from the drainages using plastic water sampler, 3L cleaned bottles before use; they were rinsed several time in 0.1N hydrochloric acid for several days and then rinsed and protected in diluted acid to prevent degradation of oil to give proper result of analysis. During the period of study, the wastewater samples are collected from two sides of the location and mixed to make composite sample which represent one station.
Extraction of oil – Extraction of petroleum oil from seawater samples
Apparatus
Separating funnel
Round bottom flask
Solvents
Concentrated hydrochloric acid (Adwic)
Carbon tetrachloride (Adwic)
Procedure
100 ml of the seawater sample was shaken with 100ml of carbon tetrachloride in a separating funnel for 15 minutes. After 30 seconds agitation and 3 minutes settling period, the aqueous layer was discarded. The process was repeated until all of seawater sample has been extracted. The obtained extract was dried using anhydrous sodium sulphate (30g). The extract was then transferred to a weighted beaker and finally evaporated by electrical furnace at 60 0C till constant weight, (16, & 17).
The oil content was calculated as: µg of oil/L = (A-B) x106
mL of water sample
Where: A and B are the weight of flask after and before extraction
High performance liquid chromatography analysis
PAH identification and quantification in the extracted oil was performed using HPLC technique (18). The apparatus used was water HPLC 600, Auto Sampler 616 Plus, Dual Absorbance Detector 2487, attached to a computerized system with Millennium 32 Software. The following were the HPLC conditions: the sample volume was 100 μl; the column used was Supelcosil LC-PAHs 15 cm, 4.6 mm ID, 4-μm particles; mobile phase was achieved using a acetonitrile/water ratio of 60:40 and was changed gradually to 100 % acetonitrile within 20 min. The flow rate was 1.2 ml/min, and the detector used was a UV type, 254 mm.
Results and Discussions
The samples were chosen for this study according to their locations and activities. The PAHs were present in higher levels in semi-enclosed areas such as marinas and harbors, due to more intensive pollution and higher accumulation of pollutants as consequence of the limited circulation of seawater. The Suez Gulf is one of the most industrialized and urbanized area in Egypt. The principal industries around the Gulf include the iron and steel industry petroleum production, metal manufacturing. Production of chemical and food industry also, loading and unloading of ships in harbors and sewage discharges from the coastal cities in this region, which enter the Gulf through anthropogenic activities.
Concentration of Individual PAHs in Suez Gulf
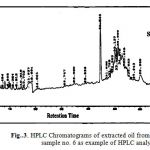
Seven surface seasonal water samples were collected from Suez Gulf and analyzed by high performance liquid chromatography technique which is very useful in the field of analysis of PAHs. Figs. 3 & 4 shows the PAHs fingerprint of the studied water samples. All samples are characterized by the presence of low polyaromatic hydrocarbons (di & tri-aromatic ring) and high polyaromatic hydrocarbons (10HPAHs) compounds, (tetra – penta & hexa aromatic ring). HPAHs are more carcinogenic than either smaller or longer ring system (19, 14).
Di-aromatic rings: Summer water samples show high values for S.NO. (1) 38.718 and S.NO. (7) 18.90 µg/L respectively, and low values for S.NO. (4) 0.251 and S.NO. (5) 1.135µg/L respectively Table 2. Close values were observed for winter water samples Table 3, S.NO. 3, 7 and 2 exhibit naphthalene (Nap) content 1.574, 1.586 and 1.674 µg/L respectively, also S.NO. 4& 5 represented close values 2.684 and 2.345 µg/L respectively, beside S.NO. (1) 0.916 µg/L. The presence of naphthalene at these stations suggests fresh petroleum pollution
Tri-aromatic rings: PAHs were below the detection limit at station (3) in summer season, excluding anthracene (Ant) has trace value 0.0279 µg/L as predominated in Table 2 acenaphthene (Ace) is present in S.NO. 1, 2, 5, 6 and 7 are 3.818, 20.488, 31.616, 10.847 and 3.095 µg/L respectively as predominant PAHs. All winter water samples have tri- aromatic rings except for the absence, of acenaphthene (Ace) in S.NO. 4 beside, anthracene (Ant) and flourence (F) was below the detection limit for S.NO. 4, 5 &7 respectively in addition, flourence (F) and phenantherene (Phe) not detected only in S.NO. 7. High value of PAHs 129.899 µg/L with the predominant of acenaphthene (Ace) at S.NO.6 Tables 3.
Tetra aromatic rings: Present completely in summer water samples S.NO. 1, 4 & 7 and chrysene (Chr) not detected in S.NO.3, 5 & 6 but found in low concentration at S.NO. 1, 2 and 7 with values 0.039, 0.008 and 0.017 µg/L respectively Table 2 chrysene (Chr) reverse values in S.NO. (1) 0.0412 and (2) 0.047 µg/L for winter samples. Benzo (a) anthracene (BaA) is present in S.NO. 2 & 4 with values 0.224 and 0.026 µg/L respectively. The results show predominant of fluoranthane (Flu) in S.NO. 2 & 5 display values 4.228 and 0.692 respectively, Table 3.
Penta – aromatic rings: are completely present in S.NO. 1, 2 with the predominance of benzo [A] pyrene (BAP) in S.NO. 2, 3, 5 & 6 in summer waters samples Table 2. Benzo [K] flouranthene [BKF] recorded values (3) 3.004, (4) 2.794 & (6) 0.811 ug/L, also winter samples Table 3, detect values for S.NO. (1) 34.049, (6) 71.1004 µg/L from benzo [a] pyrene (BaP) respectively. Bezo [K] fluoranthene (BKF) and dibenzo [a,h] anthracen (DahA) found in both sites (2&3). The high concentration of benzo [a] pyrene and dibenz [a,h] anthracene contributed the highest carcinogenic exposure equivalent, highest values of HPAHs in S.NO. (5) 210.732 µg/L from benzo [K] fluoranthene (BKF) as the predominance
Six aromatic rings compound: Benzo [ghi] perlyene (Bp) recorded values ranged from 0.060 to 2.871 µg/L for summer samples Table 2, while winter samples under the level of detection Table 3. Moreover, Indeno [1, 2, 3- cd] Peryene (IP) pointed values between 0.116 and 1.761 µg/L for summer water Table 2 and (6) 0.743 µg/L in winter sample Table 3. The presence of relative high content of perylene in seawater indicated terrestrial inputs of hydrocarbons beside; the amount of BP measured in this study was most probably related to the incomplete fuel combustion of the boats and vehicle engines that were extensively used in the Gulf. The high PAHs are the only aromatic compounds present; they have high carcinogenic effect. Generally, these results are higher than the safe limits of the EPA National Recommended Water Quality Criteria for the protection of aquatic life and human health (0.020 𝜇gL−1) (20). The amount of PAHs detected in the studied areas obviously related to urban runoffs, sewage discharges, and intense shipping and oil refinery activities. Ship breaking and oil seepage from industrial activities near the studied area lead to high concentrations of total PAHs. Additionally, boats and ships transports in these regions were discharging black smokes throughout their movement; hence there are many nonpoint sources in the Gulf, contributing to the wide variations of PAH concentrations detected.
|
|
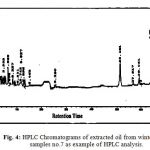 |
Figure 4: HPLC Chromatograms of extracted oil from winter water samples no.7 as example of HPLC analysis. |
Table 2: Concentration of individual PAHs (µg/L) in oil extracted from summer waters sample
| Ring no. | PAHs | S.no.1 | S.no.2 | S.no.3 | S.no.4 | S.no.5 | S.no.6 | S.no.7 |
| 2Rings | Nap. | 38.718 | 1.412 | n.d. | 0.251 | 1.135 | 5.813 | 18.9 |
| 3Rings | A.
Ace. F. Phe. Ant. |
6.301
3.818 1.009 0.026 0.023 |
1.745
20.488 0.116 0.040 0.029 |
n.d.
n.d. n.d. n.d. 0.0279 |
0.27
n.d. 2.427 0.013 0.013 |
11.042
31.616 0.322 0.266 0.007 |
1.784
10.847 2.462 0.420 n.d. |
n.d
3.095 0.008 0.162 0.005 |
| Total | 49.895 | 22.42 | 0.028 | 2.974 | 44.388 | 21.326 | 22.170 | |
| 4Rings | Flu.
Pyr. BaA. Chr. |
0.108
0.085 0.132 0.039 |
n.d.
0.208 n.d. 0.009 |
0.233
0.237 n.d. n.d. |
0.605
0.121 0.606 2.722 |
0.463
0.267 0.186 n.d. |
n.d.
n.d. 0.264 n.d. |
0.024
0.255 0.039 0.017 |
| Total | 0.364 | 0.217 | 0.470 | 4.054 | 0.915 | 0.264 | 0.335 | |
| 5Rings | BbF.
BkF. BaP. DahA |
0.582
0.369 0.604 0.262 |
0.068
0.887 31.82 1.068 |
n.d.
3.004 25.436 n.d. |
n.d.
2.794 n.d. 3.287 |
0.095
n.d. 19.022 0.390 |
n.d.
0.811 1.192 n.d. |
n.d.
n.d. n.d. n.d. |
| Total | 1.817 | 33.843 | 28.44 | 6.081 | 19.507 | 2.008 | n.d. | |
| 6Rings | BP.
IP. |
2.871
0.140 |
0.060
1.2507 |
0.584
0.054 |
2.167
0.116 |
0.146
1.761 |
2.440
0.971 |
n.d.
n.d. |
| Total | 3.011 | 1.311 | 0.638 | 2.283 | 1.907 | 3.411 | n.d. | |
| Total PAHs | 55.084 | 59.198 | 29.576 | 15.39 | 66.718 | 27.004 | 22.505 | |
n.d.: Not determined, (under the limit of detection), Concentration: µg/L
Table 3: Concentration of individual PAHs (µg/L) in oil extracted from winter waters sample
| Ring no. | PAHs | S.no.1 | S.no.2 | S.no.3 | S.no.4 | S.no.5 | S.no.6 | S.no.7 |
| 2 Rings | Nap. | 0.916 | 1.675 | 1.575 | 2.684 | 2.345 | 3.163 | 1.5862 |
| 3 Rings | A.
Ace. F. Phe. Ant. |
5.102
2.901 1.532 0.242 0.303 |
4.684
7.475 6.281 0.412 0.059 |
1.804
3.650 2.116 0.232 0.091 |
0.205
n.d. 0.142 0.058 n.d. |
2.289
14.245 n.d. 0.106 0.160 |
6.196
121.29 1.807 0.152 0.459 |
2.424
5.040 n.d. n.d. 0.0163 |
| Total | 10.996 | 20.586 | 9.468 | 3.089 | 19.145 | 133.067 | 9.067 | |
|
4 Rings |
Flu.
Pyr. BaA. Chr. |
n.d.
n.d. n.d. 0.042 |
4.228
0.279 0.224 0.047 |
n.d.
n.d. n.d. n.d. |
n.d.
n.d. 0.026 n.d. |
0.692
n.d. n.d. n.d. |
n.d.
n.d. n.d. n.d. |
n.d.
n.d. n.d. n.d. |
| Total | 0.042 | 4.778 | n.d. | 0.026 | 0.692 | n.d. | n.d. | |
| 5 Rings | BbF.
BkF. BaP. DahA. |
n.d.
n.d. 34.049 n.d. |
n.d.
0.304 n.d. 2.566 |
n.d.
9.195 n.d. 5.615 |
n.d.
n.d. n.d. n.d. |
n.d.
210.732 n.d. 4.326 |
47.880
n.d. 71.100 n.d. |
n.d.
18.738 0.696 0.192 |
| Total | 34.049 | 2.869 | 14.81 | n.d. | 215.058 | 118.980 | 19.626 | |
| 6 Rings | BP.
IP. |
n.d.
n.d. |
n.d.
n.d. |
n.d.
n.d. |
n.d.
n.d. |
n.d.
n.d. |
n.d.
0.743 |
n.d.
n.d. |
| Total | n.d. | n.d. | n.d. | n.d. | n.d. | 0.743 | n.d. | |
| Total PAHs | 45.087 | 28.234 | 24.278 | 3.115 | 234.895 | 252.786 | 28.693 | |
n.d.: Not determined, (under the limit of detection), Concentration: µg/L
The concentrations of individual TPAHs in the seasonal studied water samples Fig. 5, ranging from 15.392 up to 66.718 µg/L and 3.115 to 252.786 µg/L for summer and winter seasons respectively. The high PAHs concentrations was reported at inlet of sewage site (5) 66.718 µg/L and outlet of electricity sites (2) 59.199 µg/L also, inlet of electricity station recorded value 55.085µg/L and low value at Moon beach 15.392 µg/L in summer water samples. Moreover, the highest PAH concentrations were recorded at inlet and outlet of Attaqa sewage 234.895 & 252.786 µg/L for winter and summer season samples respectively; the lowest concentration 3.115 µg/L was represent at moon beach. Generally winter season samples represented high concentrations of TPAHs than summer, several previous studied (21, 11) were carried out in order to determine the seasonal variability of PAHs concentrations in seawater. Results of previous studies suggest that seasonal variations in PAHs concentration are generally connected to temperature. Lower concentrations of PAHs observed during summer, while higher concentrations during winter. The decreasing of concentrations in summer could be a result of accelerated degradation due to higher water temperature that also affects the rate by which PAHs are degraded by microorganisms or due to higher photo – oxidations additionally, previous studied (22 – 24) has also suggested that seasonal variation in PAHs concentration could be also, attributed to hydro- logical and meteorological conditions. The concentrations in excess of 10 ug/L, suggesting that the water in the area was heavily contaminated by PAHs, such a wide range of PAHs at different concentrations indicates that there are potentially many different sources of PAHs in the area, possibly including combustion followed by oil residues, sewage outfalls, and industrial wastewater. From the distribution of PAHs in water alone, it is difficult to differentiate these different sources of input. The data can act as an indication of the potential impacts of such high levels of PAHs on the local ecosystems.
The total PAH concentrations found in water along Suez Gulf, are several orders of magnitude higher than those detected in various other studies around the world. Similarly, comparable high levels of PAHs were also found in seawater samples of Mumbai Harbor Line, India ranged between 8.66 to 46.74 ug/L Dhananjayan et al. (25). Day Bay, China represented values between 4.228 and 29.32 ug/L by Zhou et al. (26) and Gulf of Trieste, Northern Adriatic a reverse values 0.01 up to 48.51 ug/L by Jørgensen et al., (23) Gulf of Suez Cairo, Egypt recorded 1.64 and 39.139 ug/L Eman (11). Lower level was found at Deep Bay, South China between 0.0247 and 0.069 ug/L, by Qiu et al. (27), Western Taiwan Strait, China pointed values 0.0123and 0.058 ug/L by Wu et al., (28). In addition Alexandria Coast, Egypt represent values 0.013 to 0.120 ug/L by El-Nemr et al., (29) and Saronikos Gulf (Greece) exhibit values ranged 0.425 to 0.459 ug/L Valavanidis et al. (30). Although PAHs do not show extremely high acute toxicity to aquatic organisms, the lower molecular mass compounds tend to exhibit higher lethal toxicity than the larger PAHs (31) moreover, lethal concentration (LC50) down to less than, 10 μg/L has been reported for various organisms (32, 33). The PAH concentrations detected in water samples of inlet and outlet sewage Company S.NO.(5,6) for summer and winter respectively clearly show Fig.5, that the concentrations are greater than 10 μg/L, as a result, acute toxicity may have been caused to certain exposed organisms (31). It should be noted that different numbers of target analysts (PAH congeners) and instrument were employed in individuals studies.
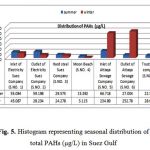 |
Figure 5: Histogram representing seasonal distribution of total PAHs (µg/L) in Suez Gulf |
Poly-aromatic hydrocarbons and pollutants origin in surface waters of Suez Gulf
PAHs distributions are the most useful tool in distinguishing pyrogenic hydrocarbons from petrogenic hydrocarbons. It has been recognized that in general, pyrogenic PAHs are characterized by the dominance of the high molecular mass (4 -6) rings PAHs over low molecular mass (2-3) rings PAHs. Tables 2&3 displays the presence of pyrogenic PAHs in samples mixed with petrogenic origin PAHs which are prevalence in lower molecular weight compounds (LPAHs) and readily affected by weathering or degradation processes. Therefore, all studied area are contaminated by mixed pyrogenic and petrogenic origin. PAHs with (2-3) rings are generally of petrogenic origin related to petroleum including crude oil and its refined products, (31). The presence of naphthalene at all seasonal studied samples, suggested fresh petroleum pollution, high concentrations of phenanthrene at all seasonal studied samples indicates the presence of petrogenic origin, fluoranthene, pyrene and chrysene; exhibit pyrogenic sources. Petrogenic favors the formation of thermodynamically stable PAHs while, pyrolysis at high temperature generates the less stable isomers thus, (phe/Ant) and (Flu/Pyr) have been used to distinguish between pyrolytic and petrogenic origin of PAHs. Where (Phe/Ant) ratio higher than ten are seen in petroleum inputs while, values lower than ten are characteristic of pyrogenic source (23, 11).
Tables 4 show that, Phe/Ant ratio for S.NO.1, 2 & 4 are less than ten indicating mainly pyrogenic origin (34), while S.NO. 5 (39.746) has Phe/ Ant ratio > 10 suggests petrogenic origin for summer water sample. On the contrary, all winter studied samples Table 5 indicating less ratio show pyrolytic origin. The ratio of (Flu/Pyr) also indicates the origin of PAHs. A predominance of fluoranthene over pyrene is characteristic of pyrolytic sources. Tables 4& 5 exhibit that S.NO.1, 4 & 5, for summer and S.NO. 2, for winter samples have mainly pyrogenic origins. In addition, (BaA /Chr) ratio supports the pyrogenic origin of S.NO. 1, 2 for summer and winter samples, the presence of anthracene (Ant) confirm this conclusion. Other study (35) suggested that a ratio of (Chr/ BaA)>1 indicates petrogenic origin, while a value <1 show pyrolytic sources, results from Chr/BaA. Table 4 representing values 0.295, 0.445ug/L for S.NO. 1 &7 denotes pyrolytic sources whereas, S.NO. (4) 4.491 ug/L, confirmed petrogenic origin for summer sample, winter sample 2 (0.208) indicates pyrolytic sources Table 5. Moreover, high concentration of benzo[a] pyrene and dibenz (DahA) anthracene contributed the highest carcinogenic exposure equivalent, benzo [a] pyrene [BaP] over dibenzo [a,h] anthracene (DahA) ratio suggested high values at sites 5,2 &1 in summer Table 4, while the rest samples in winter were below the detection limit except for site 7 recorded value 3.637 µg/L Table 5. BaP/BP ratio is used for exhibit the pollution from the Gulf traffic through the port, as from the industry and sewage out falls from the city of Suez gulf, the offshore area around the city of Gulf unpolluted part, this is in agreement also, with concentrations of PAH in surface sea water in this area, the relatively high concentrations of BaP/BP ratio found at sites 2, 5 &3 with values 532.982, 130.29 and 43.555ug/L respectively. Tables 4, 5 are most probably due to the influence of intensive sea traffic through the ports, as well as industrial and sewage discharges from the coastal cities in this region (23). Besides, the above mentioned ratios some other PAHs isomers ratios, such as (BaA / (BaA + Chr), The calculated diagnostic benzo [a] anthracene : benzo [a] anthracene + chrysene ratio of between <0.2 and >0.35 (35), suggests that the sources of PAHs at the majority of the stations studied are derived primarily from pyrogenic sources, from incomplete fuel combustion of the boats and vehicle engines, with lesser amounts of PAHs contributed from petrogenic sources, some stations displayed mixed sources. (Flu / Flu + Pyr) ≤0.5, from petrogenic or >0.5 pyrogenic sources, seasonal water samples Tables 4, 5 have high values >0.5 reverse pyrogenic sources, and Indeno [1, 2, 3-cd] pyrene to indeno [1, 2, 3-cd] Pyrene plus Benzo [ghi] Perylene (IPy / (IPy+BPE), have been developed for a more detailed interpretation of PAHs composition and interference of possible sources.
One of the most used approaches is to compare the sum of several pyrogenic (4-6 rings PAHs) with a group of petrogenic PAHs (2-3 rings PAHs); since the 2-3 ring PAHs are more abundant in petroleum. While, highly condensed PAHs (4-6 ring PAHs) are highly significant combustion products, pyrogenic sources, such as the composition- derived particles present in urban atmospheric dust, were depleted in low molecular weight 2-3 rings PAHs (LPAHs) and enriched in high molecular weight 4-6 rings PAHs (HPAHs), which led to LPAHs / HPAHs ratio <1(36). Petrogenic sources, such as fuel oil or light refined petroleum products, were dominated by low molecular weight PAHs and have LPAHs/HPAHs ratio >1. Indeed, the higher LPAHs/ HPAHs ratio, the higher the prevalence of petrogenic sources, (37, 38, & 11). Also, the ratio of sum of LPAHs over the sum HPAHs may be assessed in Tables 4, 5 for seasonal water samples, summer samples number 2, 4 & 7 suggesting LPAHs/ HPAHs <1 confirm pyrolytic sources, whereas, S.NO. 1, 6&7 are petrogenic origins have LPAHs / HPAHs > 1 ratio. On the other hand, winter water samples recorded highest ratio for LPAHs/ HPAHs at S.NO. 2, 4& 6 indicating petrogenic origin, while, lowest ratios are represented at samples 1, 3, 5 & 7 confirming the presence of PAHs of pyrolytic sources. However, this generally suggests that PAHs can be largely from the transport traffic results in chronic marine pollution from discharges of oily ballast water and tank washings by vessels, operational spills from vessels loading or unloading at port, and accidental spills in Suez Bay. Other forms of ship-generated waste include oily sludge bilge water, garbage and marine debris.
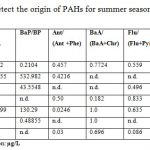 |
Table 4: PAHs parameters used to detect the origin of PAHs for summer season |
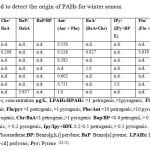 |
Table 5: PAHs parameters used to detect the origin of PAHs for winter season |
In the present study for the identification of PAHs origin in surface seawater the ratios of LPAHs /HPAHs and Flu/Pyr were examined at Table 6 which have been suggested by other researchers, (12,14). For better determination of PAHs sources the ratio of LPAHs / HPAHs against Flu/Pyr ratio were plotted, seasonal seawater samples with LPAHs / HPAHs ratio <1 and Flu/Pyr >1 suggested pyogenic sources as recorded at Moon beach for summer while, samples with LPAHs/HPAHs ratio <1 and Flu/Pyr < 1 suggested mixed sources (petrogenic and pyogenic). The diagnostic PAH ratios indicate that PAHs can be largely attributed to pyrogenic (pyrolytic) sources with a lesser amount contributed by petrogenic source, which is possibly due to the no burning fuel discharge of the inefficient two stroke engines of Gulf boats. Some stations displayed mixed sources.
Table 6: Seasonal variation of PAH ratios of surface waters in the Gulf of Suez
| Seasons | Summer | Winter | |||
| S.NO.
|
Sample name | LPAHs/HPAHs | Flu/Pyr | LPAHs/
HPAHs |
Flu/Pyr |
| 1 | Inlet of Electricity Company | 9.6119 | 1.2693 | 0.3225 | n.d. |
| 2 | Outlet of Electricity Company. | 0.6738 | n.d. | 2.6925 | 15.161 |
| 3 | Hard steel Company | 0.0009 | n.d. | 0.6391 | n.d. |
| 4 | Moon Beach. | 0.2394 | 5.031 | 119.403 | n.d. |
| 5 | Inlet of Attaqa Sewage Company | 1.988 | 1.738 | 0.0887 | n.d. |
| 6 | Outlet of Attaqa Sewage Company | 3.756 | n.d. | 1.1114 | n.d. |
| 7 | Trust company | 65.2059 | 0.094 | 0.4619 | n.d. |
LPAHs: Low molecular weight PAHs; HPAHs: High molecular weight, PAHs:
Phe: Phenanthrene; Flu: Fluoranthene; Pyr: Pyrene.
Seasonal distribution of PAHs (%) in surface seawater according to their number of aromatic rings
The seasonal distribution of PAHs (%) in surface seawaters of Gulf Suez according to their numbers of aromatic rings Figs 6, 7 & Tables 7, 8. It’s clear that 2-3 ring PAHs is the most abundant PAHs in surface seawaters. Predominance of low molecular weight PAHs (2-3 ring PAHs) over high molecular weight PAHs (4-6 ring PAHs) in seawaters is in according with some other studies, (27). 2-3 ring PAHs showed dominance in summer samples at stations 7, 1, 6, 5, 2&4 with percentage between 0.096% and 98.498 % Table 7 & Fig. 6, whereas winter water samples recorded predominance for S.NO. 4, 2, 6, 3, 7, 1, 5 respectively and represent values from 8.151 to 99.170 % Table 8 & Fig.7, in addition, 4-ring PAHs pointed an increase at S.NO. (4) 26.343 % for summer sample Table 7& Fig. 6. Also, station 2 in winter waters suggested predominance of PAHs 4-ring distribution with percentage 16.921 % and values ranged between 0.092 to 16.921% for all studied samples Table 8 & Fig.7.
The higher concentration of higher molecular weight PAHs has been commonly observed in summer samples for 5 –rings display percentage between 3.298 and 97.713% (Table 8 & Fig. 5). On the other hand, winter water samples reverse percentage values from 10.161 to 91.555% with the prevailed of S.NO. (5) 91.555% Table 8 & Fig.7. Six ring compounds from Benzo [ghi] Perelyene (BP) and Indeno [1, 2, 3-cd] Perelyene (IP), prevailed at S.NO. 4, 6 &1 have values 14.839, 12.632 and 5.466% respectively, Table 7, Fig. 6, on the contrary lowest percentage recorded at S.NO. (6) 0.294% at winter samples only Table 8 & Fig. 7, the highest abundance of BP measured in this study was most probably related to the incomplete fuel combustion of the boats and vehicle engines that were extensively used in the Gulf, (20). Usually, low molecular weight PAHs predominate in seawater while high molecular weight PAHs well reach to bottom (14, 23). Such a difference in contaminant abundance by different PAH assemblages is expected due to at least two factors. First, the water column receives direct PAH inputs from various sources, including both petrogenic and pyrolytic. In the surface seawater of Suez Gulf, the petrogenic sources may be more widespread and dominate than pyrolytic ones, leading to the abundance of 2-3ring PAHs in seawater. Second only those PAHs that are stable enough will reach at the bottom. Such PAHs are quite likely to be of relatively high molecular mass and hence more resistant to degradation, evaporation and dissolution processes. In addition, processes such as biodegradation will attach PAHs leading to accumulation of those PAHs more resistant to degradation. Again, it is mainly the high molecular mass PAHs that are more stable. As a result, the water samples were dominated by different PAHs. Generally, the most abundant 2-3 ring compounds of phenanthrene, anthracene, acenaphthene and naphthalene were present in both summer and winter season samples. Predominance of low molecular weight PAH (2-3 ring PAHs) over high molecular weight PAHs (4-6 ring PAHs) in seawater is accordance with some other studies.
Table 7: Distribution of PAHs% in summer waters according to the number of aromatic rings
| Site no. | Location | 2-3 Rings% | 4
Ring% |
5
Ring% |
6
Ring% |
| 1 | Inlet of Electricity Company | 90.577 | 0.660 | 3.297 | 5.466 |
| 2 | Outlet of Electricity Company. | 40.255 | 0.366 | 57.168 | 2.214 |
| 3 | Hard steel Company | 0.096 | 1.615 | 97.713 | 2.192 |
| 4 | Moon Beach. | 19.329 | 26.343 | 39.517 | 14.839 |
| 5 | Inlet of Attaqa Sewage Company | 66.534 | 1.372 | 29.238 | 2.859 |
| 6 | Outlet of Attaqa Sewage Company | 78.973 | 0.978 | 7.418 | 12.632 |
| 7 | Trust company | 98.494 | 1.506 | n.d. | n.d. |
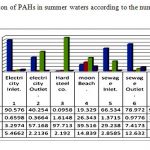 |
Figure 6: Distribution of PAHs in summer waters according to the number of aromatic rings |
Table 8: Distribution of PAHs in winter waters according to the number of aromatic rings
| S.NO. | Location | 2-3 Rings% | 4
Ring% |
5
Ring% |
6
Ring% |
| 1
|
Inlet of Electricity Company | 24.385 | 0.092 | 75.524 | n.d. |
| 2 | Outlet of Electricity Company. | 72.918 | 16.921 | 10.161 | n.d. |
| 3 | Hard steel Company | 38.993 | n.d | 61.008 | n.d. |
| 4 | Moon Beach. | 99.170 | 0.831 | n.d. | n.d. |
| 5 | Inlet of Attaqa Sewage Company | 8.1505 | 0.295 | 91.555 | n.d. |
| 6
|
Outlet of Attaqa Sewage Company | 52.639 | n.d. | 47.068 | 0.294 |
| 7 | Trust company | 31.595 | n.d. | 68.405 | n.d. |
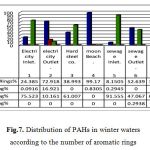 |
Figure 7: Distribution of PAHs in winter waters according to the number of aromatic rings |
Conclusions
This work has provided important data about PAHs concentrations, distribution and sources in Suez Gulf. Seasonal variation of total (TPAHs) concentrations measured with HPLC indicates higher concentration in winter compared to summer. The values represented ranged between 15.392 up to 66.718 μg/L in summer and 3.115 to 252.79 μg/L in winter. This attributed to accelerated degradation as a result of higher water temperature that also, affects the rate by which PAHs are degraded by micro- organisms or due to higher photo- oxidations additionally and also attributed to hydro- logical meteorological conditions. The main sources of PAHs, is shown to be either petrogenic or mixed petrogenic and pyrogenic. The PAHs group profile shows predominance of 2-3 ring PAHs in surface seawaters, with percentage between 0.0959- 98.498% and 8.151 up to 99.170% for summer and winter seasons respectively, lethal concentration (LC50) down to less than 10 μg/L as a result, acute toxicity may have been caused to certain exposed organisms. Because the Suez Gulf is used in many areas as a recipient of waste water from different sources this; study recommended that pollution control for wastewater disposing into it should be improved. More detailed studies are required to assess the impact of hydro- development projects and evaluate its effect on the studied area and monitoring should be conducted at least twice per year. The pollutants detected endanger the life of the micro-organisms and the food chain in the marine environment, there for the environmental conservation effects still needed to be strengthened and must used Environmental low for 1994 year, which specific for the protection of water, and shores.
References
- Omayma E. Ahmed, Sawsan A. Mahmoud and Mohamed M. El Nady. Levels, compositions, and quality of some Egyptian surface sediment from Suez Gulf, as integrated from polycyclic hydrocarbons.Energy Sources, Part A: Recovery, Utilization, and Environmental Effects, 39 (7), PP. 664–672 (2017)
- Omayma, E. A., Sawsan, M. A., and El Nady M. M.. Application of polycyclic aromatic hydrocarbons in identification of organic pollution in seawater around Alexandria coastal area, Egypt. J. Environ. Life Sci. 1: PP.39–55, (2016).
- El-Tokhi, M.M. and Mustafa, Y.M., Heavy metals and petroleum Hydrocarbons contamination of Bottom sediment of El- Sukhna Area, Gulf of Suez, Egypt, petroleum scenic and technology, Vol. 19 , no. 5, 6, pp. 481-491,( 2009).
- Renee I.A., Roushdie, M.I. Monitoring of pollution in sediments of the coasts in Egyptian Red Sea, Egyptian Journal of Petroleum 25, PP.133–151, (2016).
- Djome, J.E., Dauta, A., Ferrier V., narbnn, J. F. and Monkiedje, A., Toxic Effects of major polyaromatic Hydrocarbons found In crude Oil and Aquatic sediments on Scendesmus suspicious ” water Research, Vol.38 ,PP. 1817- 1812, (2004).
- Omayma, E. Ahmed, Mohamed, M. El Nady and Sawsan, A. Mahmoud. Assessment of polycyclic aromatic hydrocarbons of organic richness in seawater from some coastal area around Alexandria city, Egypt, Petroleum Science and Technology, 36 ,9-10, PP. 682-687, (2018).
- Liu, Chen y., Jianfu l., ainghui Z., zhiliang zhiliang H., hangmen G., Distribution and sources of polycyclic aromatic Hydrocarbons in surface sediment of rover and estuary in shanghai China, environmental pollution, Vol. 154, PP. 298 – 305, (2008).
- Paolo, M. T., Maria, A., polycyclic aromatic hydrocarbon, loads into the Mediterranean estimate of Sarno River imputes marine pollution Bulletin, Vol. 64, Issue 3, PP. 512- 520, (2012).
- Ma, Y.G, Cheng, J.P., Jiao F., Duo, Z., Rong, k-z, Li, M. and Wang, W. H., “Distributions sources and potential risk of polycyclic aromatic hydrocarbons (PAHs) in drinking water resources from Henan province in Middle of china “Environment, Assess, Vol.164, PP.127 – 138, (2008)
- Renee, I. A., Nagla, M. K., and Roushdie, M. I. Monitoring of pollution in Egyptian Red Sea. Egypt. J. Petrol. 24: 59–70, 2015.
- Omayma E. Ahmed, Sawsan A. Mahmoud and Mohamed M. El Nady. Organic Sources in the Egyptian Seawater around Alexandria Coastal area as integrated from polycyclic aromatic hydrocarbons (PAHs), Egyptian Journal of Petroleum 26, 819–826, (2017)
- Nazik A. Farid and Omayma E. Ahmed, Abd el-Rahman M. mousa, Contamination of Water, Sediment, Tar ball and Fishes by Poly-aromatic Hydrocarbons (PAHs) in Alexandria Sea Coasts, Journal of Applied Sciences Research, ISSN 1819-544X. 9 (11): 5619-5632, (2013).
- IP, Standards for Analysis and Testing of Petroleum and Related Products, (1993).
- Mostafa, M. Emara, Nazik, A. Farid, Enas A. El-Sabagh, Omayma E. Ahmed, Eman M. Kama, Origin and Distribution of Polycyclic Aromatic Hydrocarbons (PAHs) In Surface Water of Suez Gulf, Egypt. J. Anal. Chem., Vol. 23, PP. 54-73, (2014)
- Remip working Groups (WG2), (JICA and EEAA), State of oil pollution and Management in Suez Gulf region, pp 15, (2008).
- Moustafa, Y.M., Environmental Assessment of Petroleum Contamination of Gamasa. Damietta Beaches Orien, J. of Chem., Vol. 20 nol. 2PP. 219-226, (2004).
- El-Tokhi, M.M. and Moustafa, Y.M., “Heavy Metals and Petroleum Hydrocarbons Contamination of Bottom Sediment of El-snkhna Area, Gulf of Suez, Egyptian petroleum science and technology, Vol. 19 no. (5/6), PP. 481-494, (2001)
- Shou-Feng, C., Richard, A., Mowery Vanessa, A., Casttebery, G., Peter van, W., Kevin Chamblies, C., High-Performance Liquid chromatography a., vol.1104, PP. 54-61, (2006).
- Neff, J.M., Sauer, T.C., Composition, Fate and effects of produced water Discharges to near shore Maine waters, SCi. Res., Vol. 46, PP. 371-385, (1992).
- Essam, N., Lee, Y. H., Zuriati, Z. and Salmijah, S., Concentrations and Sources of Polycyclic Aromatic Hydrocarbons in the Seawater around Langkawi Island, Malaysia, Hindawi Publishing Corporation, Journal of Chemistry, Volume 2013, 10 pages, (2013).
- Park, S.S., kin, Y., kang, Chi, J., Atmosphere polycyclic aromatic Hydrocarbons in Seoul, atmospheric environment, Vo. l., 36, 2917-2924, (2002).
- Sharma, H., jain khan, V. k., Identification of polycyclic aromatic Hydrocarbons (PAHs) in suspended particulate matter by syunchrous fluorescence spectroscopic technique petrochemical acts part a. Molecular and bimolecular spectroscopy, Vol, 68, PP.43 – 49, (2007).
- Ludvik, P., MSC., Thesis entitled, Polycyclic Aromatic hydrocarbons in the seawater and sediments of the gulf of Triests, University of Nova Gorica graduate school, Nova Gorica, (2010).
- Jørgensen, S. E., Nielsen, S. N. and Jørgensen, L. A., Handbook of Ecological Parameters and Ecotoxicology, Elsevier, Amsterdam, the Netherlands, (1991).
- Dhananjayan, V. Muralidharan, S. and Vinny, R. Peter, Occurrence and Distribution of Polycyclic Aromatic Hydrocarbons in Water and Sediment Collected along the Harbor Line, Mumbai, India Hindawi Publishing Corporation International Journal of Oceanography, Volume Article ID, 403615, pp.7, (2012).
- Zhou, J. L., Maskaoui, K., Distribution of polycyclic aromatic hydrocarbons in water and surface sediments from Day Bay, China,” Environmental Pollution, Vol. 121, no. 2, pp.269–281, (2003).
- Qiu, Y.W., Zhang, G.Q., L.L., Guo, X.D., Li, O., wai., Polycyclic aromatic hydrocarbons (PAHs) in the water column and sediment core deep Bay, South China, Estuarine, Coastal and Shelf Science, 83, 60-66, (2009).
- Wu, Y. L., Wang, X. H, Li, Y. Y, and Hong, H. S., “Occurrence of polycyclic aromatic hydrocarbons (PAHs) in seawater from the Western Taiwan Strait, China,” Marine Pollution Bulletin, Vol. 63, no. 5–12, pp. 459–463, (2011).
- El-Nemr, A., Abd-Allah, A.M.A., Contamination of Polycyclic aromatic hydrocarbons (PAHs) in micro layer and subsurface waters along Alexandria Coast, Egypt, Chemosphere, Vol. 52, no. 10, pp. 1711–1716, (2003).
- Valavanidis, A., Vlachogianni, Th., triantafillaki, S., Dassenakis, M., Androutsos, F., Scoullos, M., Polycyclic aromatic Hydrocarbons in surface seawater and in indigenous mussels (mytilus galloprovincialis) from coastal areas of the Saronikos Gulf. Greece, Estuarine, coastal and shelf science, Vol.79, no.733, (2008)
- Law, R. J., Dawes, V. J., Woodhead, R. J., and Matthiessen, P.,“Polycyclic aromatic hydrocarbons (PAH) in Seawater around England and Wales,” Marine Pollution Bulletin, Vol. 34, no. 5, pp. 306–322, (1997).
- Barron, M. G., Podrabsky, T. S., Ogle, and Ricker, R. W., Ricker,“Are aromatic hydrocarbons the primary determinant of petroleum toxicity to aquatic organisms?” Aquatic Toxicology, Vol. 46, no. 3-4, pp. 253–268, (1999)
- Omayma, E. Ahmed, Nabila, A. Ali, Sawsan, A. Mahmoud and Mamdouh, M. Doheim, Environmental Assessment of Contamination by Petroleum Hydrocarbons in the Aquatic Species of Suez Gulf, ISSN: 2166-074 Florida, USA. International Journal of Modern Organic Chemistry, 3(1): 1-17, (2014).
- Brandli, M., Bucheli, T.D Kupper, T., Mayer, J., Stadelman, F.X., Taradellas, J., Fate of PCBS, PAHs, and their sources characteristic ratio during composting and digestion of source-separated organic waste in full-Scale plants, Environmental pollution, Vol.148, PP.520-528, (2007).
- Soclo, H.H., Carrigues, P.H.and Ewald, M., Origin of polycyclic aromatic hydrocarbons (PAHs) in coastal marine sediments: Case Studies in Cotonous (Benin) and Aquitaine (France) areas, Marine pollution Bulletin, Vol. 40, PP.387-396, (2000).
- Baumard, P., Budzinski, H., Garrigues, P., Polycyclic aromatic hydrocarbons in sediments and mussels of the western Mediterranean Sea, Environmental toxicology and chemistry , Vol.17, PP.765-776, (1998a).
- Baumard, P., Budzinski, H., Michon, Q., Garrigues, P., Bugeot, T., Bellocq, J., Origin and bioavailability of PAHs in the Mediterranean Sea from mussel and sediments records, Estuarine, Coastal and Shelf Science, Vol. 47, PP.77-90, (1998b).
- Wang, X.C., Sum, S., Ma, H.O., Liu, Y., Sources and distribution of aliphatic polyaromatic hydrocarbons in sediments of Jiaozuo Bay, Qingdao, China, Marine pollution Bulletin, Vol.52,PP.129-138, (2006).