
Introduction
Crystallization is the main method of purification, separation and control of solid behavior in pharmaceutical industry [1-2]. During crystallization, the solid products normally crystallize in more than one crystal structure due to different conformation and packing arrangement of molecular in the crystal lattice, which is known as the polymorphism [3-4]. Since polymorphism has distinguished physical-chemical properties such as solubility, dissolution rate, stability, mechanical properties and bioactivity, etc, control of polymorphism has become a vital issue in any pharmaceutical process. Thus, the Food and Drug Administration (FDA) requires all the pharmaceutical manufacturers submit the approval of desired polymorph [5].
Control of polymorphism is complicated since it depends on many crystallization conditions, in which the scale-up effect is an important factor to impact on polymorphic crystallization. In general, the crystallization is tested via small working volume at laboratory due to low cost and risk, etc, yet the properties of crystal product frequently change when the working volume of crystallizer is scaled up to the industrial-plant scale. For example, Ferrari et al [6] indicated when using small working volume of 50 ml at temperature of 450C, feed concentration of 48 (g/L) and agitation speed of 150-160 rpm, the phase transformation time of α-form to β-form L-glutamic acid was 8 min, whereas it prolonged up to 190 min at the large scale of 1000 ml. Moreover, Ferrari et al [7] also reported that the phase transformation time of β-form to α-form Glycine was 34 min as using small working volume of 50 ml, but it was 102 min at large scale of 1000 ml, etc.
In contrast, the present study investigated the effect of scale-up on properties of L-glutamic acid solid product including mean size, size distribution and phase transformation during cooling crystallization. Here, the crystallization of L-glutamic acid was carried out at temperature of 30 (0C), feed concentration of 45 (g/L), agitation speed of 300-700 (rpm) and cooling rate of 4 (0C/min).
Materials and Methods
The pilot-plant and laboratory scale have the same geometric configuration, which was designed followed the standard stirred tank crystallizer [8]. Here, the working volume of pilot-plant scale was 10 liters, while it was 0.4 liter in case of laboratory scale, meaning that the pilot-plant scale was 25 times larger than laboratory scale, as shown in Figure 1. The agitation speed of both crystallizers was varied from 300 rpm to 700 rpm and controlled via the DC motor.
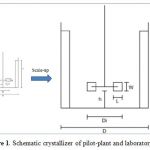 |
Figure 1: Schematic crystallizer of pilot-plant and laboratory scale |
The L-glutamic acid material (>98% purity) was supplied by the Institute of Chemical Technology-VAST. The feed solution was prepared by dissolving the L-glutamic acid material into the distilled water at temperature of 70 (0C) and the feed concentration was fixed at 45 (g/L). Initially, the crystallizer was fully filled with the feed solution, and then operated as the batch mode cooling crystallization. During crystallization, the solution temperature gradually decreased from 70 (0C) to equilibrium temperature of 30 (0C) with cooling rate of 4 (0C/min), where the cooling rate was controlled via the circulating coolant from the chiller.
The suspensions were periodically taken from the crystallizers and quickly filtered by using a vacuum pump. The solid products were then dried in a desiccator and analyzed to define the shape, structure and crystal fraction of α-form and b-form. Here, the shape of solid product was monitored via Optical microscope, while the crystal structure of two polymorphs was detected by FT-IR spectroscopy (Perkin Elmer, System 2000 FT-IR, USA). The crystal size and size distribution was measured by using Sieving, in which the coefficient size distribution (n) was estimated via Rosin Rammler Sperling Bennet (RRSB) method [1, 9].
Results and Discussion
The crystallization of L-glutamic acid in pilot-plant scale was investigated at varied agitation speed of 300-700 rpm, feed concentration of 45 (g/L) and cooling rate of 4 0C/min, as shown in Figure 2-3. When the crystallization was operated at 300 rpm, the prism shape of solid product was observed at crystallization time of 26 min, which corresponded to the α-form solid product [10], and it was detected even crystallization time of 300 h, as depicted in Figure 2(a). Here, the β-form was not found in the solid product during crystallization, meaning that the phase transformation of α-form to β-form did not occur in this operating condition. Since the phase transformation of α-form to β-form depended on the intensity of fluid hydrodynamic of crystallizer, increasing agitation speed may attribute to promote the phase transformation of α-form to β-form. Yet, when increasing the agitation speed to 700 rpm, the only prism shape of α-form solid product was observed even crystallization time of over 300 h, as displayed in Figure 2(b)-(c), implying that the only α-form solid product was crystallized in pilot-plant scale, and the crystal structure of α-form was also confirmed via the XRD and FT-IR analysis [10]. The mass fraction of β-form in the solid product was confirmed by FT-IR analysis [10].
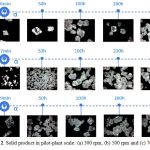 |
Figure 2: Solid product in pilot-plant scale: (a) 300 rpm, (b) 500 rpm and (c) 700 rpm |
In order to crystallize the pure β-form solid product, the 5%wt seed β-form was added to the suspension, as shown in Figure 3. Here, the α-form solid product initially appeared, but partly disappeared due to the phase transformation of α-form to β-form at crystallization time of 4 h. The α-form was then completely transformed to β-form after crystallization time of 30 h, implying that the pure β-form solid product could be crystallized as using the 5%wt seed β-form in pilot-plant scale.
 |
Figure 3: Phase transformation as using 5% β-form seed in pilot-plant scale |
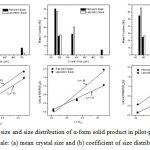
The comparison between pilot-plant and laboratory scale in terms of solid product properties was investigated as shown in Figure 4-5. Although the operating conditions of both crystallizer was similar at the same agitation speed of 300-500 rpm, feed concentration of 45 (g/L) and cooling rate of 4 (0C), there was significant difference between two crystallizers as regards mean crystal size, size distribution and phase transformation. As shown in Figure 4(a), the mean crystal size of α-form solid product was 260 µm in pilot-plant scale, whereas it was 220 µm in case of laboratory scale, implying that the mean crystal size in pilot-plant scale was 14% larger than that in laboratory scale at the same agitation speed of 300 rpm. In addition, the size distribution of α-form solid product in pilot-plant scale was slightly broader than that in laboratory scale, where the coefficient size distribution (n) was estimated as 1.53 and 1.58 in pilot-plant and laboratory scale, respectively, as depicted in Figure 4(b). When increasing the agitation speed to 500-700 rpm, the mean crystal size of α-form solid product in pilot-plant scale was also 14% larger than that in laboratory scale, and the size distribution was broader than that in laboratory scale, as displayed in Figure 4(a)-(b).
As regards the phase transformation of α-form to β-form, the phase transformation was monitored in laboratory scale, where the α-form initially crystallized at crystallization time of 18.5 min, and completely transformed to β-form after crystallization of 16 h, as depicted in Figure 5(a). When increasing the agitation speed to 500-700 rpm, the completion time of phase transformation reduced to only 12 h and 10 h, respectively, as displayed in Figure 5(b)-(c). However, the phase transformation was not observed in case of pilot-scale scale even crystallization time of over 300 h, as shown in Figure 2. As such, the phase transformation of α-form to β-form in laboratory scale was much more facilitated than that in pilot-plant scale.
The difference between pilot-plant and laboratory scale in terms of L-glutamic acid crystallization was originated from scale-up effect, where the suspension circulation has a long distance as meter in pilot-plant scale, while it is few centimeters in laboratory scale. As such, the collision frequency between crystal and impeller in pilot-plant and laboratory scale was different, where it related with the secondary nucleation of α-form and β-form [1-2, 11]. Indeed, when the α-form crystal collided to the impeller, the small fragment of α-form would be generated and become new α-form nuclei which would determine the α-form solid product. Moreover, since the β-form grown on the surface of α-form [10], the collision between the α-form and impeller also generated the secondary nucleation of β-form, resulting in promotion of phase transformation of α-form to β-form. The collision frequency between crystal and impeller in pilot-plant and laboratory scale was estimated as:
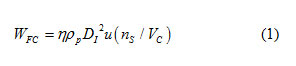
Here, DI and u are the impeller diameter and velocity, respectively, while nS are the number of particle in crystallizer. VC and rp are the crystallizer volume and density of particle, respectively. Meanwhile, the target efficient (η) was defined
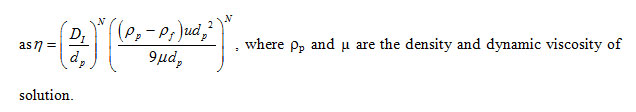
Additionally, the secondary nucleation rate of α-form and β-form in pilot-plant and laboratory scale was expressed as [1-2, 11]:
J = WFC/Vc (2)
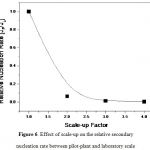
From (1) and (2) the secondary nucleation rate (J) was defined as J∞D-1-4 , which was plotted in Figure 6.
As shown in Figure 6, the secondary nucleation rate of α-form and β-form decreased rapidly as increasing the scale-up factor, meaning that the final product of α-form and phase transformation of α-form to β-form in pilot-plant and laboratory scale was certainly different. Indeed, when the secondary nucleation rate of α-form in pilot-plant scale was lower than that in laboratory scale, the mean crystal size in pilot-plant scale was certainly larger than that in laboratory scale, as depicted in Figure 4(a). However, the large working volume of pilot-plant scale provided a non-homogeneous supersaturation profile [8], so the crystal size would be more broadly distributed compared to that in laboratory scale, as displayed in Figure 4(b). Additionally, due to the low nucleation rate of β-form, the phase transformation of α-form to β-form was extremely prolonged in pilot-plant scale, where the completion time of phase transformation was estimated over 970 h, meaning that crystallization time of 300 h was not enough to have the completed phase transformation of α-form to β-form in pilot-plant scale, as displayed in Figure 2.
 |
|
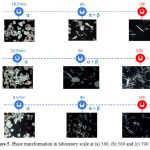 |
Figure 5: Phase transformation in laboratory scale at (a) 300, (b) 500 and (c) 700 rpm |
 |
|
Conclusion
The present study indicated that the scale-up effect was an important factor to determine the properties of solid product of polymorphic L-glutamic acid including mean crystal size, size distribution and phase transformation during cooling crystallization. This finding was valuable in order to adjust the operating conditions from the laboratory scale to industrial scale production, where the properties of solid product were different between laboratory and pilot-plant scale. Here, the mean crystal size in pilot-plant scale was larger than that of laboratory scale, yet the size distribution in pilot-plant scale was broader than that in laboratory scale. In addition, the phase transformation of α-form to β-form was proceeded in laboratory within 10-16 h, but it did not occur in case of pilot-plant scale even crystallization time of over 300 h. The difference between laboratory and pilot-plant scale was explained via the secondary nucleation effect determined by the scale-up effect. Here, the secondary nucleation rate was less facilitated in pilot-plant scale compared to that in laboratory scale, which resulted in larger mean crystal size and broader size distribution. Plus, due to the lower secondary nucleation rate in pilot-plant scale, the phase transformation of α-form to β-form was extremely prolonged even beyond 300 h crystallization time. However, when using the 5% seed β-form the pure β-form solid product could be crystallized in pilot-plant scale.
Acknowledgements:
This work was supported by Vietnam Academy of Science and Technology (VAST) and Industrial University of HoChiMinh City.
References
- Mullin, J.W.; Crystallization. Oxford, 1993.
- Myerson, A.S.; Handbook of Industrial Crystallization. Oxford, 1993.
- Brittain, H.G.; Polymorphism in Pharmaceutical Solids. Marcel Dekker Inc, New York, 1999.
- Bernstein, J.; Polymorphism in Molecular Crystals. Oxford, 2002.
- Bbyrn, S.; Pfeiffer, R.; Ganey, M.; Hoiberg, C.; Poochikian, G.; Phar. Res. 19, 12: 945-954.
- Ferrari, E.S.; Davey, R.J.; Cryst. Growth. Des. 2004, 4: 1061-1068.
- Ferrari, E.S.; Davey, R.J.; Cross, W.I.; Gillon, A.L.; Towler, C.S.; Cryst. Growth. Des. 2003, 3: 53-60.
- Nguyen, A.T.; Yu, T.; Kim, W.S.; J. Cryst. Growth. 2017, 469: 65-77.
- Shan, G.; Igarashi, K.; Noda, K.; Ooshima, H.; Chem. Eng. J. 2002, 85: 161-167.
- Dang, T.G.; Khuu, C.Q.; Trinh T.T.H.; Nguyen, A.T.; Vietnam Journal of Chemistry. 2016, 54: 515-519.
- Yokota, M.; Takezawa, E.; Takakusaki, T.; Sato, A.; Takahashi H.; Kubota, N.; Chem. Eng. Sci. 1999, 54: 3831-3838.