
Introduction
Green chemistry has emerged as an essential multidisciplinary field aimed at reducing the ecological footprint of chemical manufacturing and distribution. This research seeks to develop environmentally friendly alternatives that replace traditional chemical processes, reducing waste, conserving resources, and increasing the use of biodegradable materials. While technological and scientific advances have boosted economic growth globally, they have also led to environmental degradation, evident in climate change, ozone depletion, and accumulation of persistent organic pollutants. Azelnidipine (AZLNDPN), chemically known as 3-1-Benzhydryl-3-azetidinyl 5-isopropyl 2-amino-6-methyl-4-(m-nitrophenyl)-1,4-dihydropyridine-3,5-dicarboxylate, functions by blocking L-type calcium channels in vascular smooth muscle, leading to vasodilation and reduced blood pressure. AZLNDPN has proven effective in treating hypertension, owing to its distinctive pharmacokinetic profile and therapeutic benefits.
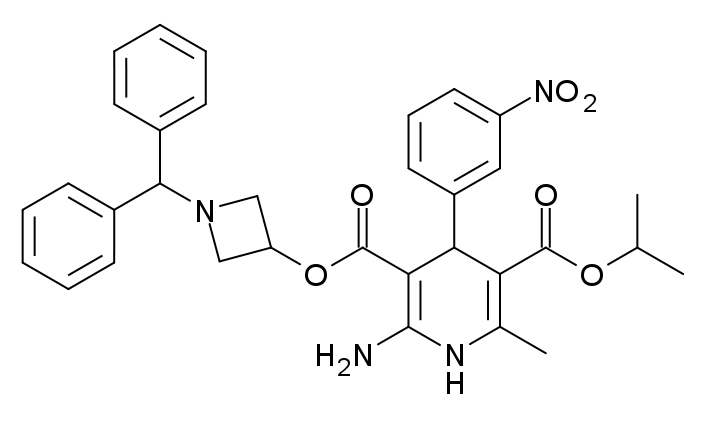
Fig. 1: Chemical structure of AZLNDPN
AZLNDPN has been analyzed in tablet and biological samples using UV-visible spectroscopy, HPLC, and LC-MS techniques. Existing UV spectrophotometric methods, however, have limitations such as narrow linearity range and lack of sensitivity parameters. To address these, a Quality by Design (QbD) strategy was adopted to develop an improved UV spectrophotometric method for AZLNDPN quantification in tablet formulations.
QbD, a holistic framework endorsed by the International Council for Harmonisation (ICH-Q8 R2), ensures that quality is integrated throughout method development. By defining clear objectives and understanding both the process and desired outcomes, QbD minimizes variability and improves method robustness. Since the FDA’s introduction of “Pharmaceutical cGMPs for the 21st Century,” QbD has become integral to analytical method development. Design of Experiments (DoE), a key QbD tool, was employed to identify optimal analytical conditions, ensuring accuracy and reliability in spectrophotometric analysis of AZLNDPN. This study aimed to establish a novel, robust UV spectrophotometric method for AZLNDPN in tablets.
Materials and Methods
Reagents and Standards
A standard sample of AZLNDPN (>99.5% purity) was obtained from Laksh Finechem Pvt. Ltd. Ethanol (EtOH) used in preparing solutions was sourced from Merck Ltd., Jamshedpur. Commercial AZLNDPN tablets (Zeblong 16 mg) were purchased and analyzed using the developed method.
Instrumentation
Spectral analyses were performed using a microprocessor-controlled LI-285 UV spectrophotometer (Lasany, India) with 10 mm quartz cuvettes. A high-precision analytical balance was used for reagent measurement, and ultrasonication (Enertech, India) facilitated tablet dissolution.
Development of Analytical Target Profile
A comprehensive review of literature and AZLNDPN’s physicochemical properties was conducted to define an analytical target profile. The primary goal was to create an accurate, efficient, and cost-effective method for AZLNDPN estimation in tablet form. A UV spectrophotometric approach was selected due to its simplicity and suitability for rapid analysis.
Risk Assessment and Cause-Effect Analysis
To understand factors affecting method performance, an Ishikawa (fishbone) diagram was constructed, highlighting potential critical method variables (CMVs) such as detection wavelength, solvent type, scan rate, sample integrity, sampling interval, and pH. A Cause-Effect Risk Assessment Matrix based on the Control-Noise-Experimentation (CNX) approach helped identify high-risk CMVs for further evaluation.
Screening of CMVs Using Fractional Factorial Design (FFD)
Using Design Expert software (version 13.0.14, USA), FFD was employed to screen variables influencing method performance. Parameters like scan speed (X1), sample pH (X2), and sampling interval (X3) were studied to identify their effects on absorbance (Y), determining significant CMVs via predicted vs. actual plots, Pareto charts, and statistical summaries.
Optimization and Robustness Evaluation Using Central Composite Design (CCD)
CCD was used to optimize key CMVs. Thirteen experiments with at least five center points evaluated the effects of EtOH concentration (A) and pH (B) on absorbance at 252 nm, using 10 μg/mL AZLNDPN. Multiple Linear Regression Analysis (MLRA) modeled the data, incorporating significant coefficients (p < 0.05) identified via ANOVA. Response surfaces, prediction profilers, and desirability functions defined the optimal method space.
Method Control Strategy
The design space determined through DoE informed control strategies, allowing slight variations within defined limits to maintain method robustness.
Standard Stock Solution Preparation
A 1000 μg/mL AZLNDPN stock solution was prepared by dissolving 10 mg AZLNDPN in 10 mL EtOH. From this, a 100 μg/mL solution was made by diluting 5 mL of stock to 50 mL with water.
Tablet Analysis
Ten mg equivalent AZLNDPN from Zeblong 16 mg tablets was dissolved in 10 mL EtOH, followed by dilution, ultrasonication, and filtration. The solution was further diluted and analyzed using a calibration curve.
Method Validation
- Specificity: Assessed by comparing spectra of tablet excipients and AZLNDPN, confirming absence of interference.
- Linearity: Constructed over 2–12 μg/mL, correlating absorbance at 252 nm with concentration.
- Precision & Accuracy: Recovery studies at 80%, 100%, and 120% of 10 μg/mL were conducted. Intra-day precision was evaluated with six replicates.
Results
A UV spectrophotometric method for AZLNDPN quantification in tablets was developed using the QbD approach, ensuring optimal variable selection. The Ishikawa diagram helped identify key parameters. Solubility tests showed AZLNDPN’s solubility in water, and λmax was confirmed at 252 nm (Fig. 2).
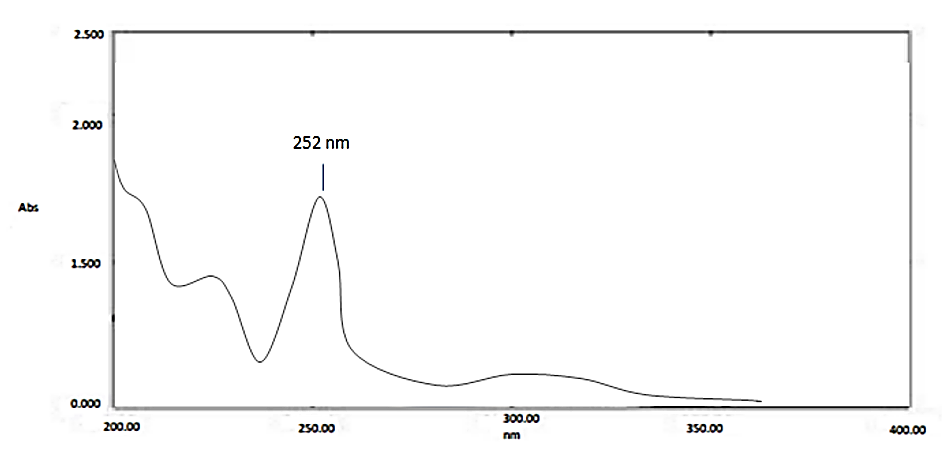
Fig 2. Typical UV absorption spectrum of AZLNDPN
Screening and CCD experiments demonstrated EtOH concentration and sample pH as significant CMVs. FFD model statistics (p = 0.0004, R² = 0.9399) confirmed the model’s fit. CCD experiments (Table 1) provided data for robustness assessment.
| Run No. | Conc. of EtOH in ml(A) | pH (B) | Absorbance (Y) |
| 1 | 2.5 | 4.5 | 0.824 |
| 2 | 1 | 6 | 0.684 |
| 3 | 2.5 | 4.5 | 0.824 |
| 4 | 1 | 3 | 0.691 |
| 5 | 2.5 | 6.62132 | 0.772 |
| 6 | 2.5 | 4.5 | 0.824 |
| 7 | 2.5 | 4.5 | 0.824 |
| 8 | 4 | 3 | 0.592 |
| 9 | 4.62 | 4.5 | 0.623 |
| 10 | 4 | 6 | 0.731 |
| 11 | 2.5 | 4.5 | 0.824 |
| 12 | 0.37868 | 4.5 | 0.663 |
| 13 | 2.5 | 2.37868 | 0.781 |
| Range | Low | High | |
| EtOH | 1 | 4 | |
| pH | 3 | 6 |
Table 1. Experimental design matrix showing spectrophotometric range studied for robustness study and obtained responses
ANOVA revealed p < 0.0005, indicating significant model predictivity. Perturbation plots (Fig. 3A) showed sample pH and EtOH concentration as major influencers of absorbance. Actual vs. predicted plots (Fig. 3B) demonstrated excellent model agreement.
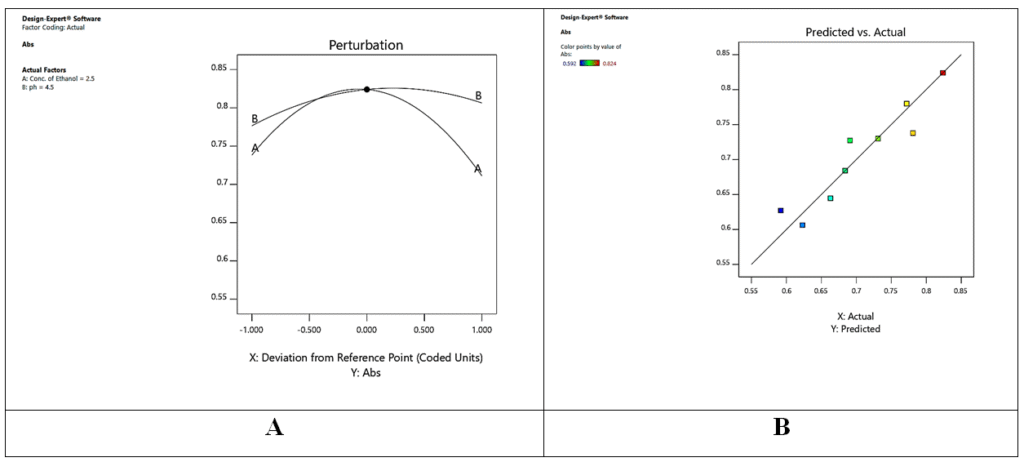
Figure 3 (A). Perturbation Plot, 3(B). Predicted vs. Actual Plot
Response surface analysis (Fig. 4) confirmed CMVs’ significant impact on absorbance.
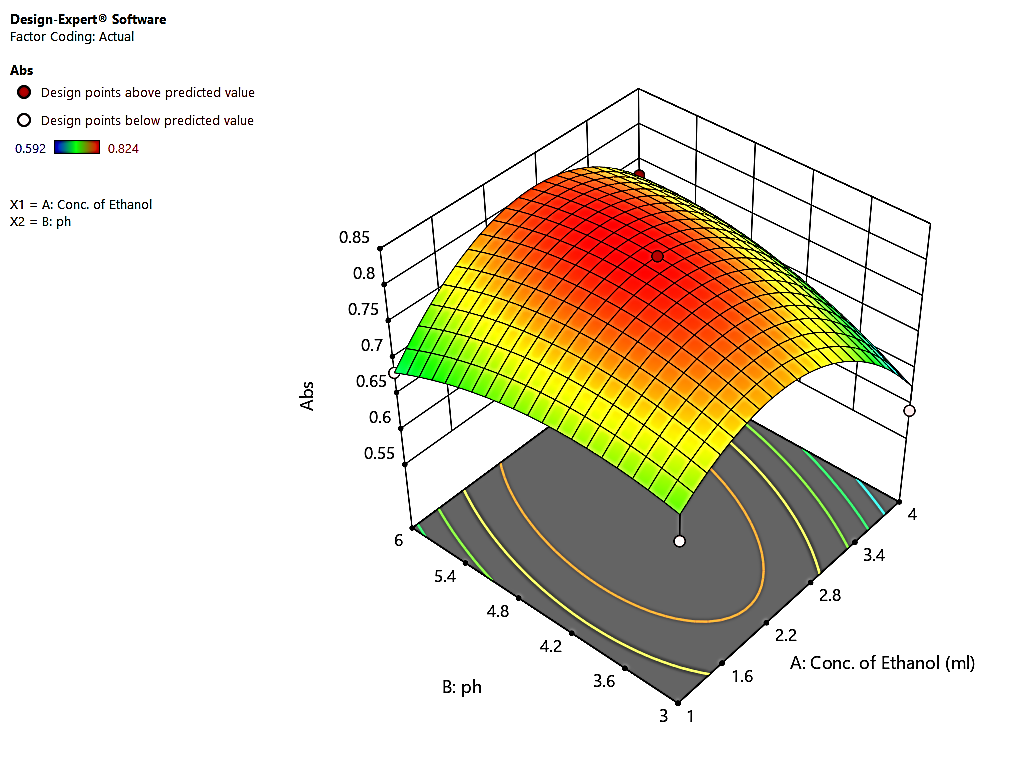
Figure 4. 3-D Response surface plot for absorbance against Conc. of EtOH Vs. pH
Optical characteristics and validation parameters are summarized in Table 2, confirming linearity (R² = 0.9999), accuracy, precision (%RSD <2%), and absence of interference.
| Parameters | Obtained Values |
| Wavelength (nm) | 252 |
| Linearity Range (μg/ml) | 2-12 |
| Molar extinction coefficient (ltr/ mol.cm) | 3.961 * 104 |
| Regression equation(Y=ax+b)* | 0.0681x + 0.0037 |
| Correlation coefficient(R2) | 0.9999 |
| Precision (% R.S.D., n=6) | 0.0842847 |
| Accuracy (% RSD ± S.D.) | |
| 80% | 0.199362 ± 0.002449 |
| 100% | 0.691547 ± 0.009428 |
| 120% | 0.162865 ± 0.002449 |
| % Range of error | |
| 95% confidence limits | ± 0.0037 |
| 99% confidence limits | ± 0.4902 |
Table 2. Optical Characteristics and Summary of validation parameters
Discussion
Accuracy studies demonstrated average recovery rates of 99.6–100.1%, with intra-day precision yielding %RSD well below 2%. These results confirm the method’s accuracy and precision. Validation outcomes indicate the method’s robustness, unaffected by tablet excipients, making it reliable for routine analysis.
Conclusion
Using the QbD approach, a precise, accurate, and robust UV spectrophotometric method for AZLNDPN quantification in tablets was developed. EtOH concentration and pH were identified as critical factors influencing method performance. Validation confirmed the method’s suitability for quality control laboratories, providing a reliable alternative for routine AZLNDPN analysis.
References
- Joshi, D. R.; Adhikari, N. World J. Pharm. Pharm. Sci. 2019, 8, 280-293.
- Sharma, P.; Kumar, M. Sharma, A.; Arora, D.; Patial, A.; Rana, M.; World J. Pharm. Pharm. Sci. 2019, 8, 202-208.
- Balamurugan, K.; Mishra, K. J. Glob. Pharma Technol. 2020, 12, 1-12.
- Mishra, K.; Balamurugan, K.; Suresh, R. Int. J. Pharm. Qual. Assur. 2018. 9, 225-230.
- Shewale, V. U.; Aher, S. S.; Saudagar, R. B. J. Drug Deliv. Ther. 2019, 9, 1002-1005.
- Reddy, M. R.; Mishra, K.; Suresh, R. Int. j. pharm. res. health sci. 2018, 6, 2303-2307.
- Mishra, K.; Padmasri, B.; Vegesna, S.; Jabeen, A.; Dash, A.; Kumar, S.; Jena, D. Int. J. Pharm. Qual. Assur. 2023, 14, 734-739.
- Sarangi, B.; Mishra, K.; Mohanta, G. P.; Manna, P. K. Eur. Polym. J. 2019, 122, 109366.
- Mishra, K.; Dash, A.; Jabeen, A.; Vegesna, S.; Sahoo, S.K.; Gupta, V.; Jena, D. Int. J. Drug Deliv. Technol. 2023, 13, 976-981.
- Gautam, M. K.; Jena, D.; Jabeen A.; Mukherjee, R.; Buralla, K. K.; Mishra, K. J. Chem. Health Risks. 2023, 13, 189-196.