
Introduction: Sacubitril is an antihypertensive drug[^1,^2] and is used in combination with Valsartan[^3,^4] in the marketed formulation Entresto, which is indicated for the treatment of heart failure[^5,^6]. The drug was approved through the FDA’s priority review process for heart failure on July 7, 2015[^7]. Sacubitril is a prodrug[^8,^9] that is converted to its active form, Sacubitrilat (LBQ657), through de-ethylation by esterases. Sacubitrilat inhibits the enzyme neprilysin[^10,^11], which is responsible for degrading atrial and brain natriuretic peptides—two blood pressure-lowering peptides[^12] that primarily function by reducing blood volume[^13,^14]. In addition, neprilysin also degrades other peptides, including bradykinin[^15,^16], an inflammatory mediator with potent vasodilatory effects[^17].
Valsartan, marketed under names such as Diovan, is used to manage high blood pressure[^18], heart failure, and diabetic kidney disease[^19]. It is commonly administered orally and is often used as an initial treatment for hypertension. Various combination formulations, such as Valsartan/hydrochlorothiazide and Valsartan/amlodipine, are also available[^20].

Fig.1. Chemical structure of Sacubitril
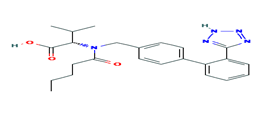
Fig. 2. Chemical structure of Valsartan
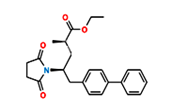
Fig.3. Structure of Sacubitril Imp-1
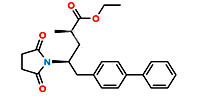
Fig.4. Structure of Sacubitril Imp-2
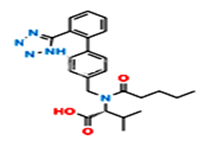
Fig.5. Structure of Valsartan Imp-A
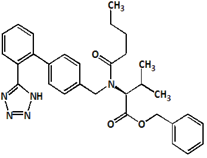
Fig.6. Structure of Valsartan Imp-B
MATERIALS AND METHODS
Chemicals
Acetonitrile, ortho-phosphoric acid (OPA), hexane sulfonic acid, triethylamine, and water were purchased from Merck (India) Ltd., Worli, Mumbai, India. Reference standards of Sacubitril and Valsartan were procured from Glenmark Pharmaceuticals, Mumbai.
Chromatographic Parameters
The method was developed and validated using a Waters Alliance HPLC system (e2695 model) coupled with an LC-MS (QTRAP 5500 triple quadrupole). Data processing was performed using Empower 2.0 software. Separation was achieved on an Inertsil C18 column (150 × 4.6 mm, 3.5 µm) using an isocratic elution. The mobile phase consisted of pH 2.5 buffer and acetonitrile in a 70:30 ratio. The flow rate was set at 1.0 mL/min, detection was performed at 224 nm, the injection volume was 10 µL, and the diluent was the same as the mobile phase.
Preparation of Test Solutions
- Standard Solution: Accurately weigh 24 mg of Sacubitril and 26 mg of Valsartan into a 100 mL volumetric flask, add 70 mL of diluent, sonicate for 10 min, and make up to the mark with diluent. Further, dilute 5 mL of this solution to 50 mL with diluent.
- Sample Solution: Accurately weigh a sample equivalent to 50 mg, transfer to a 100 mL volumetric flask, add 70 mL of diluent, sonicate for 10 min, and make up to the mark with diluent.
- Impurity Standard Stock Solution: Accurately weigh 5 mg of each Sacubitril and Valsartan impurity into a 100 mL volumetric flask, add 70 mL of diluent, sonicate, and make up to the mark.
- Spiked Sample Solution: Transfer 5 mL of sample solution into a 50 mL volumetric flask, add 30 mL of diluent, 5 mL of impurity stock solution, and make up to the mark. Filter through a 0.45 µm syringe filter.
Method Development and Optimization – Detector and Wavelength Selection
Absorption spectra of Sacubitril and Valsartan solutions were scanned from 200–400 nm using a PDA detector. Maximum absorbance for both APIs and their impurities was observed at 224 nm, which was selected for method validation.
RESULTS AND DISCUSSION
Finalization of Sample Concentration and Method Optimization
The final chromatographic method employed reversed-phase HPLC with an Inertsil C18 column (150 × 4.6 mm, 3.5 µm) using an isocratic flow of pH 2.5 buffer and acetonitrile (70:30). The flow rate was 1.0 mL/min and the column temperature was maintained at 25°C.
All impurity peaks were well-resolved with resolution >2. No interference from the blank or tablet excipients was observed at the retention times of Sacubitril, Valsartan, or their impurities. A representative chromatogram of the impurity-spiked sample is shown in Figure 7.
Parameters of the validated HPLC method are summarized in Table 1. The diluent, test concentrations, and injection volumes were optimized to ensure quantification above the limit of quantification (LOQ), and the isocratic conditions were fine-tuned to achieve optimal peak resolution.
Table 1: Optimized HPLC method conditions
| S.No | Parameters | Method Conditions |
| 1 | Column | Inertsil C18 150×4.6mm, 3.5µ |
| 2 | Flow rate | 1.0ml/min |
| 3 | Wave length | 224nm |
| 4 | Injection volume | 10µl |
| 5 | Run time | 17min |
| 6 | Mobile phase | HSA+ACN (70:30) |
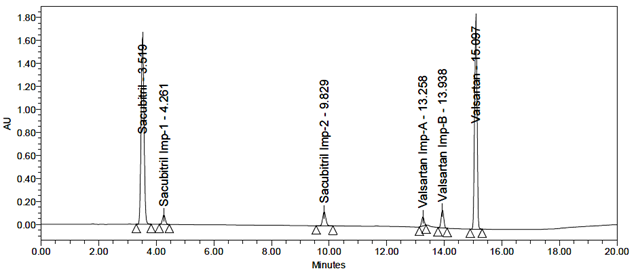
Fig 7: Typical chromatogram of Standard
System Suitability
The standard solution was injected into the HPLC system, and the system suitability parameters were found to be within acceptable limits. The relative standard deviation (RSD) for peak areas and theoretical plate count was calculated. Repeated injections showed RSD values within the specified limits. The results are presented in Table 2, and a representative system suitability chromatogram is shown in Figure 8.
Table 2: System suitability data
| S.No | System suitability parameter | Acceptance criteria | Drug Name | |
| Sacubitril | Valsartan | |||
| 1 | % RSD | NMT 2.0 | 0.98 | 1.02 |
| 2 | USP Tailing | NMT 2.0 | 0.51 | 0.89 |
| 3 | USP Plate count | NLT 3000 | 5489 | 6541 |
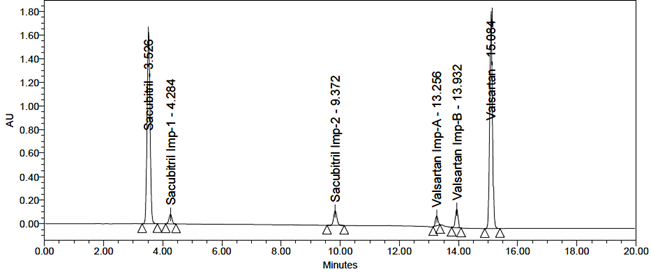
Fig 8: Typical chromatogram of system suitability
Specificity
A study was performed to assess potential placebo interference. According to the test procedure, samples were prepared by taking a quantity of placebo equivalent to the weight of a portion of the test preparation and injected into the HPLC system. No interference was observed in the chromatograms of the placebo solution, the blank solution, or the impurity solutions at the retention times corresponding to Sacubitril, Valsartan, and their related impurities.
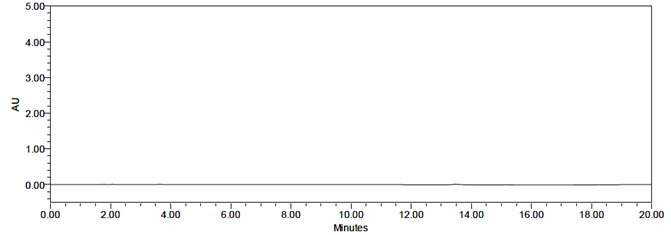
Fig 9: Chromatogram for blank
Fig 10: Chromatogram for Placebo
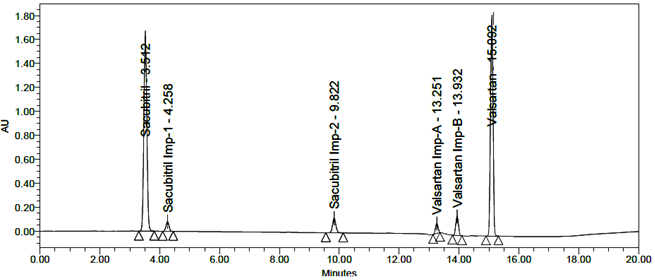
Fig 11: Chromatogram of standard

Fig 12: Chromatogram of sample
Specificity
The representative chromatograms demonstrating specificity are presented in Figures 9, 10, 11, and 12. No interference was observed in the chromatograms of the placebo solution, blank solution, or impurity solutions at the retention times corresponding to Sacubitril, Valsartan, and their related impurities.
Linearity
Linearity for Sacubitril was established over the concentration range of 2.4 µg/mL to 36 µg/mL, with a regression equation of Y = 306220x + 230176 and a correlation coefficient (R²) of 0.999.
For Impurity-1, the concentration range was 0.5 µg/mL to 7.5 µg/mL, with a regression equation of Y = 100068x + 1214.5 and R² = 0.999.
For Impurity-2, the concentration range was 0.5 µg/mL to 7.5 µg/mL, with a regression equation of Y = 121278x + 7428.1 and R² = 0.999.
Valsartan exhibited linearity in the range of 2.6 µg/mL to 39 µg/mL, with a regression equation of Y = 337378x + 15344 and R² = 0.999.
For Impurity-A, the range was 0.5 µg/mL to 7.5 µg/mL, regression equation Y = 88750x + 2772, R² = 0.999.
For Impurity-B, the concentration range was 0.5 µg/mL to 7.5 µg/mL, regression equation Y = 96279x + 3092, R² = 0.999.
The corresponding linearity graphs are shown in Figures 13, 14, 15, 16, 17, and 18.
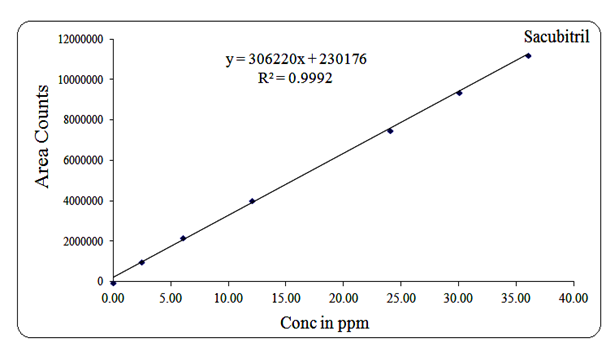
Fig 13: Linearity graph for Sacubitril

Fig 14: Linearity graph for Sacubitril Imp-1
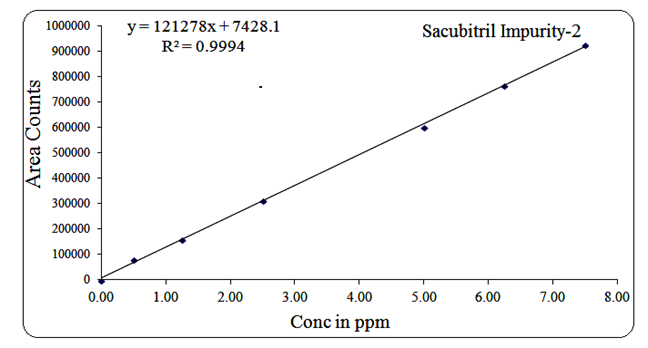
Fig 15: Linearity graph for Sacubitril Imp-2
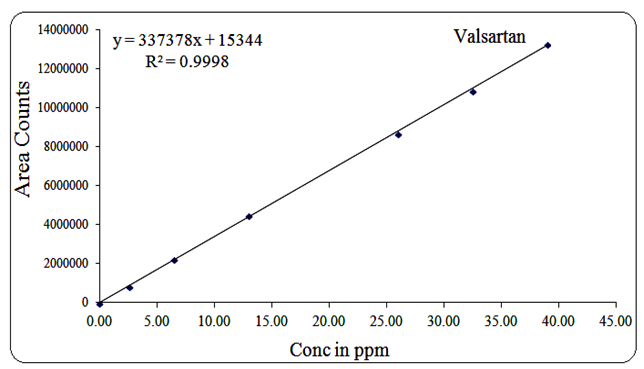
Fig 16: Linearity graph for Valsartan
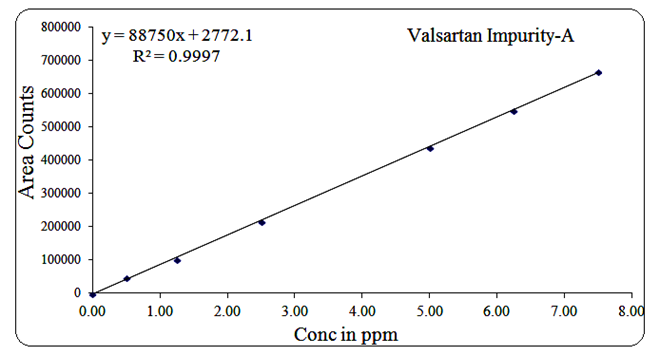
Fig 17: Linearity graph for Valsartan Imp-A
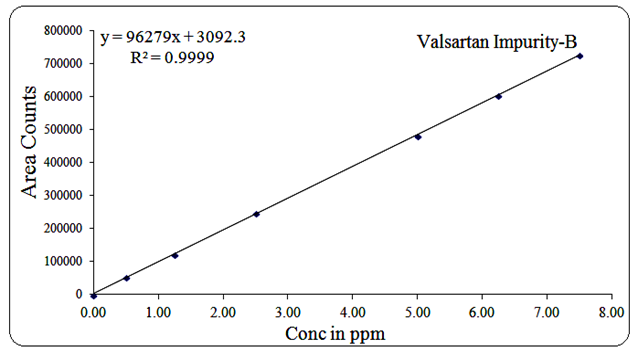
Fig 18: Linearity graph for Valsartan Imp-B
Robustness
The robustness of the method was evaluated by analyzing the system suitability standards and evaluating system suitability parameter data after varying the HPLC pump flow rate (±0.2ml) and organic solvent (±20%). The alterations cause a significant change in peak area RSD (%), USP tailing factor and retention times. The obtained results were presented in table 3.
Table 3: Robustness data
| S.No | Parameter name | % RSD for purity | |
| Sacubitril | Valsartan | ||
| 1 | Flow (0.8ml/min) | 0.89 | 1.54 |
| 2 | Flow (1.2ml/min) | 0.54 | 0.48 |
| 3 | Organic solvent (+10%) | 1.10 | 1.25 |
| 4 | Organic solvent (-10%) | 1.09 | 1.37 |
Stability
The stability of sacubitril and valsartan in solution was determined by sample solution stability initial to 24hr at different time intervals at room temperature and 2-8°C. There is no significant deviation of purity. The obtained results were presented in table 4.
Table 4: Results for solution stability
| S.No | Stability | Purity of Sacubitril | % of Deviation | Purity of Valsartan | % of Deviation |
| 1 | Initial | 100.18 | 0.00 | 99.98 | 0.00 |
| 2 | 6Hr | 100.12 | 0.06 | 99.95 | 0.03 |
| 3 | 12Hr | 100.05 | 0.13 | 99.91 | 0.07 |
| 4 | 18Hr | 99.98 | 0.20 | 98.89 | 1.09 |
| 5 | 24Hr | 99.84 | 0.34 | 98.34 | 1.64 |
Precision
Precision of the test method was determined by injecting test preparation and tested through the complete analytical procedure from sample preparation to the final result. Repeatability assessed using a minimum of 6 determinations and calculated % relative standard deviation of impurities. The obtained results were presented in table 5 and 6.
Table 5: Precision results for Sacubitril
| Sample No. | % of Related Substances | ||
| Spiked Impurities | Total Impurities | % Purity (100-Total Imp) | |
| 1 | 5.01 | 4.89 | 95.11 |
| 2 | 5.02 | 4.92 | 95.08 |
| 3 | 5.05 | 4.97 | 95.03 |
| 4 | 5.04 | 4.96 | 95.04 |
| 5 | 5.02 | 4.98 | 95.05 |
| 6 | 5.03 | 4.95 | 95.05 |
| Average | 5.03 | 4.95 | 95.06 |
| % RSD | 0.29 | 0.69 | 0.03 |
Table 6: Precision results for Valsartan
| Sample No. | % of Related Substances | ||
| Spiked Impurities | Total Impurities | % Purity (100-Total Imp) | |
| 1 | 5.00 | 4.98 | 95.02 |
| 2 | 5.01 | 4.95 | 95.05 |
| 3 | 5.02 | 4.94 | 95.06 |
| 4 | 5.00 | 4.90 | 95.10 |
| 5 | 5.02 | 4.92 | 95.08 |
| 6 | 4.98 | 4.91 | 95.09 |
| Average | 5.01 | 4.93 | 95.07 |
| %RSD | 0.30 | 0.60 | 0.03 |
Intermediate Precision
Six replicates of a sample solution were analysed on a different day, different analyst and different instrument. Peak areas were calculated which were used to calculate mean, % RSD values. The obtained results were presented in table 7 and 8.
Table 7: Intermediate precision results for Sacubitril
| Sample No. | % of related substances | ||
| Spiked Impurities | Total Impurities | % Purity (100-Total Imp) | |
| 1 | 5.00 | 4.98 | 95.02 |
| 2 | 5.01 | 4.95 | 95.05 |
| 3 | 4.98 | 4.94 | 95.06 |
| 4 | 4.99 | 4.99 | 95.01 |
| 5 | 5.02 | 5.00 | 95.00 |
| 6 | 5.01 | 4.98 | 95.02 |
| Average | 5.00 | 4.97 | 95.03 |
| % RSD | 0.29 | 0.47 | 0.03 |
Table 8: Intermediate precision results for Valsartan
| Sample No. | % of related substances | ||
| Spiked Impurities | Total Impurities | % Purity (100-Total Imp) | |
| 1 | 5.00 | 4.97 | 95.03 |
| 2 | 4.98 | 4.92 | 95.08 |
| 3 | 5.01 | 4.95 | 95.05 |
| 4 | 5.02 | 4.89 | 95.11 |
| 5 | 4.97 | 4.84 | 95.16 |
| 6 | 5.02 | 4.98 | 95.02 |
| Average | 5.00 | 4.93 | 95.08 |
| % RSD | 0.42 | 1.08 | 0.06 |
Limit of detection (LOD) and Limit of Quantification (LOQ)
LOD and LOQ were separately determined by calibration curve method. LOD and LOQ of the compound were determined by injecting progressively lower concentrations of standard solutions using developed RP-HPLC method. The slope method was used for estimation of LOD and LOQ and the equation used are LOQ= 10xσ/S and LOD= 3.3xσ/S, where S is the calibration curve slope and σ is the standard deviation of the response. The LOD and LOQ concentrations for Sacubitril is 0.02µg/ml and 0.24µg/ml and LOD and LOQ concentrations of Valsartan is 0.02µg/ml and 0.26µg/ml. The typical chromatogram of LOD and LOQ were shown in figures 19 and 20.
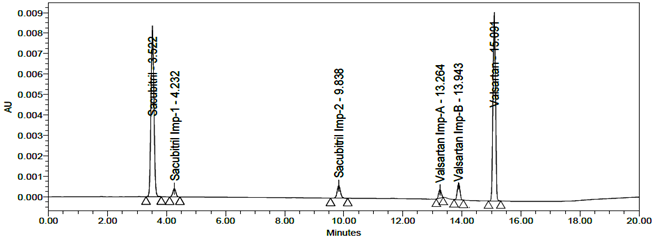
Fig 19: Chromatogram of LOD
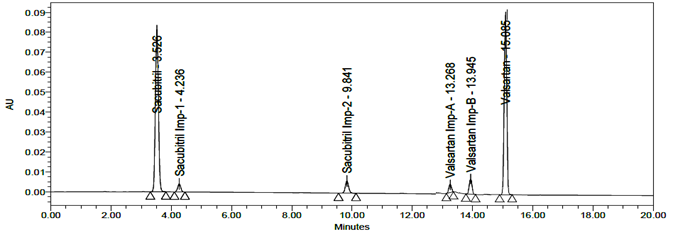
Fig 20: Chromatogram of LOQ
Accuracy
The accuracy of the related substances test procedure was determined by spiking of Sacubitril and Valsartan impurities stock solution to test the sample. So that the concentration of the impurity would be 5.0% of the test concentration as per the test method. Injecting samples in triplicate at 50%, 100% and 150% of the target concentration. The recovery results should be NLT 95% and NMT 105%. The obtained results were presented in table 9, 10, 11, 12, 13 and 14 and chromatograms were shown in the figures 21, 22 and 23.
Table 9: Accuracy results for Sacubitril
| S. No. | % Level | % Recovery | Ave % Recovery |
| 1 | 50 | 98.65 | 98.88 |
| 2 | 99.12 | ||
| 3 | 98.87 | ||
| 4 | 100 | 99.89 | 98.79 |
| 5 | 99.12 | ||
| 6 | 97.36 | ||
| 7 | 150 | 99.14 | 98.71 |
| 8 | 98.63 | ||
| 9 | 98.35 |
Table 10: Accuracy results for Valsartan
| S. No. | % Level | % Recovery | Ave %Recovery |
| 1 | 50 | 99.36 | 99.12 |
| 2 | 98.87 | ||
| 3 | 99.12 | ||
| 4 | 100 | 98.14 | 99.01 |
| 5 | 99.36 | ||
| 6 | 99.54 | ||
| 7 | 150 | 99.87 | 99.21 |
| 8 | 99.21 | ||
| 9 | 98.53 |
Table11: Acc results for Sacubitril Imp-1
| S. No. | % Level | % Recovery | Ave % Recovery |
| 1 | 50 | 98.35 | 98.65 |
| 2 | 98.47 | ||
| 3 | 99.12 | ||
| 4 | 100 | 99.35 | 99.12 |
| 5 | 99.14 | ||
| 6 | 98.87 | ||
| 7 | 150 | 99.17 | 99.15 |
| 8 | 99.54 | ||
| 9 | 98.74 |
Table12: Acc results for Sacubitril Imp-2
| S. No. | % Level | % Recovery | Ave % Recovery |
| 1 | 50 | 99.66 | 99.06 |
| 2 | 98.78 | ||
| 3 | 98.75 | ||
| 4 | 100 | 97.65 | 97.27 |
| 5 | 97.84 | ||
| 6 | 96.33 | ||
| 7 | 150 | 98.12 | 98.29 |
| 8 | 98.42 | ||
| 9 | 98.33 |
Table13: Acc results of Valsartan Imp-A
| S. No. | % Level | % Recovery | Ave % Recovery |
| 1 | 50 | 98.53 | 98.06 |
| 2 | 97.39 | ||
| 3 | 98.26 | ||
| 4 | 100 | 99.10 | 98.54 |
| 5 | 98.89 | ||
| 6 | 97.63 | ||
| 7 | 150 | 98.64 | 98.04 |
| 8 | 98.12 | ||
| 9 | 97.36 |
Table14: Acc results of Valsartan Imp-B
| S. No. | % Level | % Recovery | Ave % Recovery |
| 1 | 50 | 98.45 | 98.32 |
| 2 | 98.17 | ||
| 3 | 98.33 | ||
| 4 | 100 | 97.54 | 97.87 |
| 5 | 98.41 | ||
| 6 | 97.66 | ||
| 7 | 150 | 98.36 | 98.05 |
| 8 | 98.12 | ||
| 9 | 97.68 |
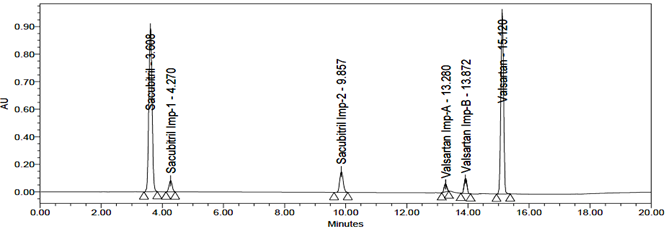
Fig 21: Chromatogram of Accuracy 50%

Fig 22: Chromatogram of Accuracy 100%
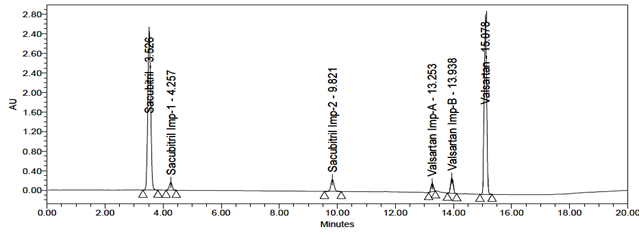
Fig 23: Chromatogram of Accuracy 150%
Degradation Effects and its characterization
The Sacubitril and Valsartan sample was subjected into various forced degradation conditions to effect partial degradation of the drug. Forced degradation studies were performed to show the method is suitable for degraded products. Moreover, the studies provide information about the conditions in which the drug is unstable so that measures can be taken during formulation to avoid potential instabilities.
Acid Degradation
During acid degradation, Sacubitril and Valsartan produced two degradation products, D1 and D2. The retention times (RTs) of D1 and D2, as detected by LC-MS, were 9.83 min and 13.93 min, respectively. These degradation products were identified as Sacubitril Impurity-2 and Valsartan Impurity-B, based on their RTs and m/z values of 600 and 620.
Procedure: 5 mL of the sample was transferred into a 50 mL volumetric flask, followed by the addition of 1 mL of 1N HCl. The solution was heated at 60°C for 30 min, then neutralized with 1 mL of 0.1N NaOH, and diluted to the mark with diluent. The final solution was filtered through a 0.45 µm nylon syringe filter before analysis.
Alkali Degradation
In alkali degradation, two degradation products, D1 and D2, were observed. The RTs detected by LC-MS were 9.83 min and 13.94 min, corresponding to Sacubitril Impurity-2 and Valsartan Impurity-B (m/z 600 and 620).
Procedure: 5 mL of sample was transferred into a 50 mL volumetric flask, followed by 1 mL of 1N NaOH. The mixture was heated at 60°C for 30 min, neutralized with 1 mL of 1N HCl, and diluted to the mark with diluent. The solution was filtered through a 0.45 µm nylon syringe filter.
Peroxide Degradation
Peroxide degradation of Sacubitril and Valsartan produced one degradation product, D1. The RT detected by LC-MS was 9.82 min, identified as Sacubitril Impurity-2 (m/z 600).
Procedure: 5 mL of sample was transferred into a 50 mL volumetric flask, followed by the addition of 1 mL of 30% H₂O₂. The solution was heated at 60°C for 30 min, cooled, diluted to the mark with diluent, and filtered through a 0.45 µm nylon syringe filter.
Reduction Degradation
Reduction degradation produced three degradation products: D1, D2, and D3. Their RTs were 9.81 min, 13.93 min, and 13.25 min, corresponding to Sacubitril Impurity-2 (m/z 600) and Valsartan Impurities-1 and 2 (m/z 542 and 620).
Procedure: 5 mL of sample was transferred into a 50 mL volumetric flask, and 1 mL of 10% sodium bicarbonate solution was added. The mixture was heated at 60°C for 15 min, cooled, diluted to the mark with diluent, and filtered through a 0.45 µm nylon syringe filter.
Thermal Degradation
No degradation products were observed under thermal stress. The sample solution was placed in an oven at 105°C for 6 hours and then injected directly into the HPLC system for analysis.
Photolytic Degradation
Photolytic degradation produced four degradation products: D1, D2, D3, and D4. The RTs detected by LC-MS were 9.82 min, 13.93 min, 4.26 min, and 13.25 min, identified as Sacubitril Impurities-1 and 2 and Valsartan Impurities-A and B based on their RTs and m/z values of 600, 620, 550, and 542.
Procedure: The sample solution was exposed to sunlight for 12 hours. The resulting solution was injected into the HPLC system for analysis. Results are summarized in Tables 15 and 16, with corresponding chromatograms shown in Figures 24–33.
Table 15: Forced Degradation Results for Sacubitril
| S.No. | Degradation Condition | % of Purity | % of Degradation | Purity Angle | Purity Threshold |
| 1 | Unstressed Degradation | 99.9 | – | 0.145 | 5.028 |
| 2 | Acid Degradation | 88.56 | 11.34 | 0.142 | 5.032 |
| 3 | Alkali Degradation | 85.31 | 14.59 | 0.138 | 5.124 |
| 4 | Peroxide Degradation | 82.98 | 16.92 | 0.156 | 5.236 |
| 5 | Reduction Degradation | 83.69 | 16.21 | 0.168 | 5.039 |
| 6 | Thermal Degradation | 86.35 | 13.55 | 0.172 | 5.051 |
| 7 | Photolytic Degradation | 88.49 | 11.41 | 0.189 | 5.044 |
Table16: Forced Degradation Results for Valsartan
| S.No. | Degradation Condition | % of Purity | % of Degradation | Purity Angle | Purity Threshold |
| 1 | Unstressed Degradation | 100.0 | – | 0.087 | 5.008 |
| 2 | Acid Degradation | 85.33 | 14.67 | 0.089 | 5.005 |
| 3 | Alkali Degradation | 87.68 | 12.32 | 0.094 | 5.028 |
| 4 | Peroxide Degradation | 80.49 | 19.51 | 0.064 | 5.124 |
| 5 | Reduction Degradation | 85.33 | 14.67 | 1.102 | 5.051 |
| 6 | Thermal Degradation | 88.18 | 11.82 | 1.025 | 5.041 |
| 7 | Photolytic Degradation | 85.16 | 14.84 | 1.001 | 5.024 |

Fig 24: Chromatogram for Acid degradation

Fig 25: Chromatogram for Alkali degradation
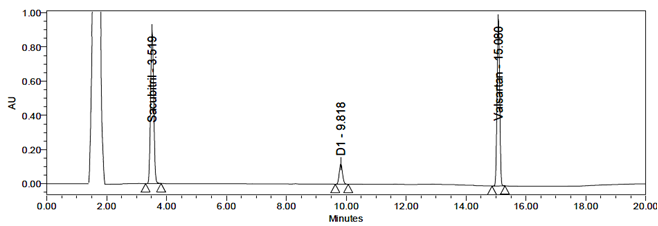
Fig 26: Chromatogram for Peroxide degradation
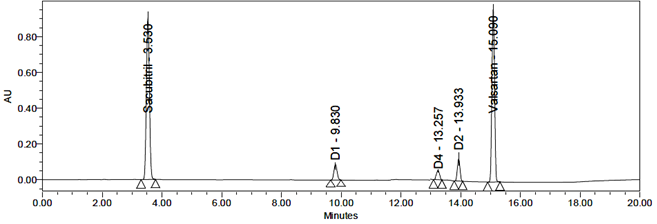
Fig 27: Chromatogram for Reduction degradation
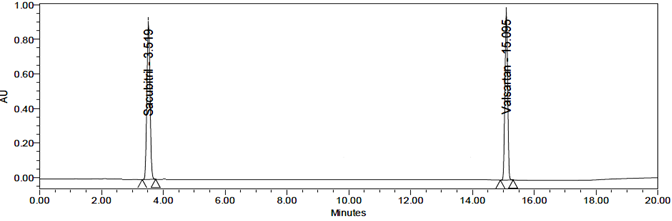
Fig 28: Chromatogram for Thermal degradation

Fig 29: Chromatogram for Photolytic degradation

Fig 30: LC-ESI-MS/MS spectrum of [M+H]+ ions of Sacubitril Imp-1(m/z 550).
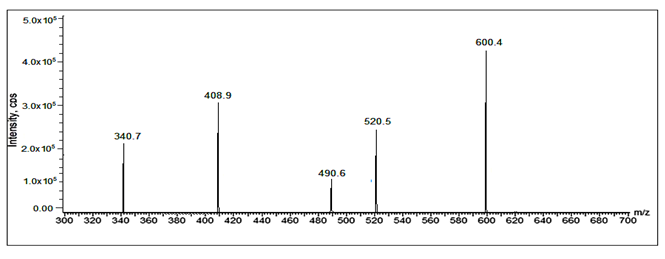
Fig 31: LC-ESI-MS/MS spectrum of [M+H]+ ions of Sacubitril Imp-2(m/z 600).
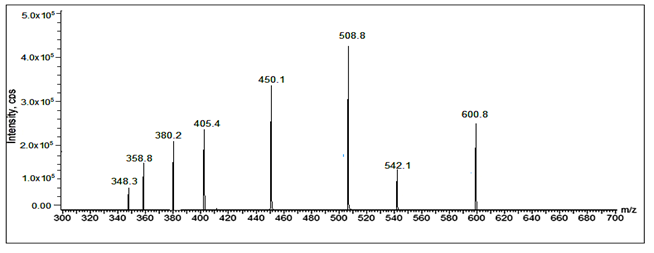
Fig 32: LC-ESI-MS/MS spectrum of [M+H]+ ions of Valsartan Imp-A(m/z 542)
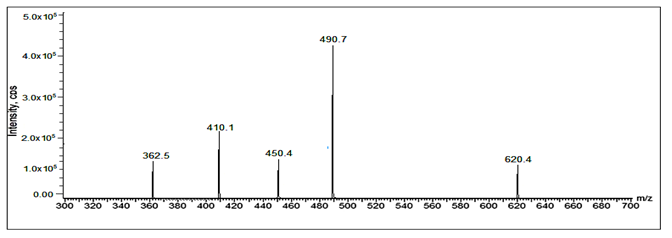
Fig 33: LC-ESI-MS/MS spectrum of [M+H]+ ions of Valsartan Imp-B (m/z 620).
Conclusion
The developed method provided excellent resolution between Sacubitril, Valsartan, and their impurities, with a short runtime, high efficiency, and compliance with the modified USP system suitability test (SST) specifications. The method was found to be simple, precise, accurate, linear, robust, and rapid for the simultaneous determination and quantification of Sacubitril and Valsartan.
Stress testing of Sacubitril and Valsartan revealed that both compounds were stable under thermal conditions but degraded significantly under acidic, alkaline, and photolytic conditions. The resultant degradation products were characterized using LC-MS/MS and HRMS data. The stability and degradation studies provide valuable insights into the behavior of Sacubitril and Valsartan during storage, aiding in the development of stable formulations and ensuring the safety and quality of these drugs in pharmaceutical production.
Conflicts of interest
The authors declare that there is no conflict of interests regarding to publication of paper.
References
- Williams, B. Treatment of hypertension in the UK: Simple as ABCD, BMJ, 2003, 96(11), 521–522.
- Wright, Jr., T.; Jackson, T. JAMA, 2002, 288(19), 2421–2431.
- Gaziano, T. A.; Fonarow, G. C.; Claggett, B.; Chan, W. W.; Deschaseaux-Voinet, C.; Turner, S. J.; Rouleau, J. L.; Zile, M. R.; McMurray, J. J.; Solomon, S. D. JAMA Cardiol., 2016, 1(6), 666–672.
- Perez, A. L.; Kittipibul, V.; Tang, W. H. W.; Starling, R. C. JACC Heart Fail., 2017, 5, 460–463.
- McMurray, J. J.; Packer, M.; John, J. V.; Akshay, S. N. Engl. J. Med., 2014, 371(11), 993–1004.
- O’Connor, C. M. Informa Healthcare, 2005, p. 572.
- Qato, D. M.; Alexander, G. C. JAMA, 2011, 306(14), 1595–1596.
- Wu, K. M. Pharmaceuticals, 2009, 2(3), 77–81.
- Rautio, J.; Meanwell, N. A.; Di, L.; Hageman, M. J. Nat. Rev. Drug Discov., 2018, 17(8), 559–587.
- Gu, J.; Noe, A.; Chandra, P.; Al Fayoumi, S.; Ligueros Saylan, M.; Sarangapani, R.; Maahs, S.; Ksander, G.; Rigel, D. F.; Jeng, A. Y.; Lin, T. H.; Zheng, W.; Dole, W. P. J. Clin. Pharmacol., 2009, 50(4), 401–414.
- Madani, R.; Poirier, R.; Wolfer, D. P.; Welzl, H.; Groscurth, P.; Lipp, H. P.; Lu, B.; El Mouedden, M.; Mercken, M.; Nitsch, R. M.; Mohajeri, M. H. J. Neurosci. Res., 2006, 84(8), 1871–1878.
- Ardejani, M. S.; Orner, B. P. Science, 2013, 340(6132), 561–562.
- Dasselaar, J. J.; van der Sande, F. M.; Franssen, C. F. Blood Purif., 2012, 33(1–3), 177–182.
- Manzone, T. A.; Dam, H. Q.; Soltis, D.; Sagar, V. V. J. Nucl. Med. Technol., 2007, 35(2), 55–63.
- Marcos-Contreras, O. A.; Martinez de Lizarrondo, S.; Bardou, I.; Pruvost, M.; Anfray, A.; Frigout, Y.; Hommet, Y.; Lebouvier, L.; Montaner, J.; Vivien, D.; Gauberti, M. Blood, 2016, 128(20), 2423–2434.
- Bas, M.; Adams, V.; Suvorava, T.; Niehues, T.; Hoffmann, T. K.; Kojda, G. Allergy, 2007, 62(8), 842–856.
- Costa, F.; Biaggioni, I. Hypertension, 1998, 31(5), 1061–1064.
- Lackland, D. T.; Weber, M. A. Can. J. Cardiol., 2015, 31(5), 569–571.
- Lewis, G.; Maxwell, A. P. Practitioner, 2014, 258(1768), 13–17.
- Eckert, S.; Freytag, S.; Muller, K.; Klebs, H. G. Blood Press., 2013, 22(1), 11–21.