
1. Introduction
In silico approaches are widely employed in pharmacological development to anticipate substance pharmacokinetic characteristics. In silico models of ADME are consistently correct. Using quantitative structure-pharmacokinetic relationship (QSPkR) methods [1-3]. Figure 1 shows the chemical structure and action spectrum of quinolones, a class of drugs that mainly inhibit DNA gyrase in bacterial cells [4]. These antibiotic drugs are effective against both Gram-negative and Gram-positive bacteria, which are known to cause various illnesses. Quinolones have seen a surge in their application in animal agriculture throughout the past 10 years. The use of antibiotics in food-producing animals has garnered significant attention and concern due to the growing issue of microbial resistance. To address this, the European Union has established maximum residue limits (MRLs) for quinolone residues in animal tissues [5]. The development of sensitive multiresidue screening procedures is necessary for the regulation of these drugs. Animal products containing quinolone residues have been the subject of numerous investigations [6]. For separation, liquid chromatography (LC) is usually the go-to technique [6,7].
Quinolone antibiotics Ciprofloxacin, enrofloxacin, nalidixic acid, norfloxacin, oxolinic acid, danofloxacin, difloxacin, sarafloxacin, and flumequine. This study first describes the synthesis of a quinolone derivative (1,8-napthapyridine-3-carboxylic acid), followed by the invention and validation of a HPLC method for detecting, identifying, and quantifying the synthetic product.
These chemicals impede DNA gyrase and topoisomerase IV, two types of bacterial type II topoisomerases [8, 9, 11, 12]. A better understanding of how quinolones interact with these enzymes has been revealed by recent studies. Resistance can result from mutations in either gyrase or topoisomerase IV. Among the resistance mechanisms include alterations in drug metabolism, uptake or efflux routes, and protein interactions. Fluoroquinolone antibiotics are great at fighting infectious infections, but they have a lot of drawbacks. There has been an abundance of reports regarding cases of multidrug resistance. Fluoroquinolone permeability can be decreased by mutations as well [7]. Their capacity to cure plasmids, promote both forward and reverse mutations, and provide good findings in genotoxicity tests [8,9] further suggests that quinolones may play a role in bacterial mutagenesis.
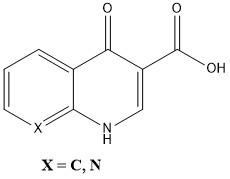
Figure 1. Structure of Quinolone
All quinolone derivatives, including ciprofloxacin and levofloxacin Nalidixic acid, may now be identified in bulk pharmaceuticals and dosage forms using high-performance liquid chromatography technologies. I’m delighted to provide an HPLC method for evaluating and separating pharmaceuticals from degeneration yields produced as recommended by the International Council for Harmonisation (ICH) conditions of hydrolysis, oxidation, and thermal stress. Using acid hydrolysis, base hydrolysis, oxidation, and heat as stress conditions for forced degradation, this paper presents the development of an HPLC approach for separating pollutants from quinolone derivatives.
2. Exprimental
2.1 Chromatographic Condition
An auto-injector, degasser, column, quaternary solvent supply pump, detector, oven, and systronic chromatographic system were its components. A chromatographic column with a length of 250 mm and an inner diameter of 4.6 mm was utilized in the analysis. The stationary phase consisted of Octadecyl Silane (Inertsil ODS 3V C18), featuring a particle size of 5 microns and a pore size of 100 Å. This configuration is well-suited for reverse-phase high-performance liquid chromatography (RP-HPLC), offering high resolution and efficiency for the separation of analytes. In 100 milliliters of methanol, 1 gram of the produced quinolone derivative was dissolved to prepare the mobile phase. The temperature of the column oven was kept constant at 35°C, and a steady flow rate of 1.0 ml per minute was used for the elution process. At 254 nm, the elution of the compounds was observed. The overall duration of the run was 65 minutes, with a volume of 10 μL for injections.
2.2 Materials and Reagent
The 1-benzyl-4-oxo-1,4-dihydro-1,8-naphthyridine-3-carboxylic acid a 1,8-Naphthyridine derivative (Fig. 2 ) Indian Patent No. 388144) was resynthesized in our lab, Potassium carbonate was available from Oxford Lab Fine Chem LLP, Loba Chemie Pvt Ltd obtained diphenyl ether 98%, Benzyl chloride was available from Pallav LLP, then N-hexane was obtained from suvidhinath laboratories, Diethyl ether was available from suvidhinath laboratories, and Petroleum ether 40 – 60 was available from suvidhinath laboratories. Methanol, Mili-Q water and HPLC grade acetonitrile was purchased from Merck life science Pvt. Ltd.
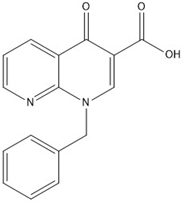
Figure 2. Structure of 1,8-Naphthyridine derivative
2.3 Preparation of sample solutions
2.3.1 Mobile Phase
The mobile phase containing Acetonitrile: Water (70:30% V/V). The mobile phase (acetonitrile and methanol) was filtered with 0.45 μ membrane filter and sonicated for 20 min.
2.3.2 Standard Stock Solution
Accurately weighed 100mg of synthesized quinolone derivative was taken and transferred it to 100ml volumetric flask. The compound was dissolved in methanol to form of a solution with a concentration of 1000 μg/ml.
2.3.3 Working sample solution
transfer 5 ml of stock solution (standard) with pipette to a 100 ml flask. The flask was filled with methanol to provide a working standard solution containing 50 μg/ml of the generated quinolone derivative.
2.3.4 Synthesis of Quinolone derivative
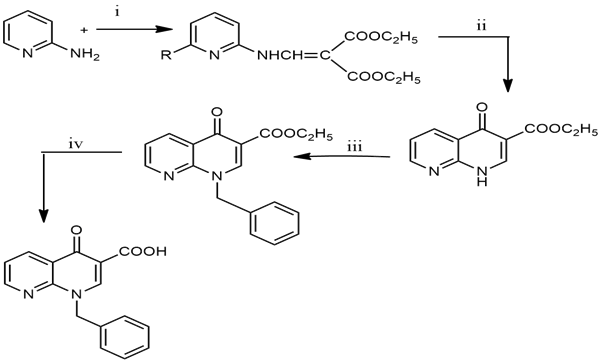
Scheme: Preparation -1,8-napthapyridine derivative
Taken 940 mg of 2-aminopyridine (0.01 mole) and 2 ml of Diethyl ethoxy methylene malonate (0.01 mol) heat at 1200C for 2 hrs. After 2 hrs to form crude malonate (ester), this crude ester is washed with petroleum ether. After Taking 20 ml of Diphenyl ether in a round bottom flask, the temperature was maintained to 240-2500C. After maintaining the temperature add crude ester (From step 1) after reflux for 2-4 Hrs. After 4 hrs cool at room temperature and wash with petroleum ether or N-Hexane, resulting in a powder of malonate. 10 ml of Dimethylformamide (DMF), powder of Malone (From step 2), and 50 mg of potassium carbonate stirred for 1 hr, after 1 hr add 10 ml of benzyl chloride and stir for 24 hrs, after 24 hrs add diethyl ether and wash with water [8].
3. Result And Discussion
3.1 Method Development of Quinolone
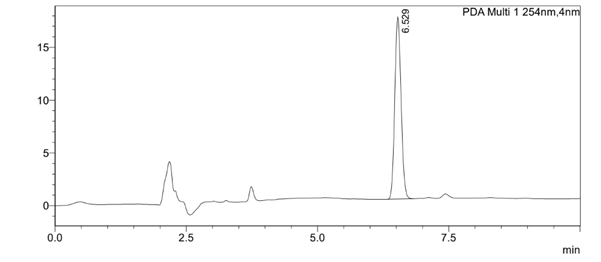
Figure 3. Typical chromatogram of the sample solution
3.2 Method Validation
3.2.1 System Suitability
The system suitability was performed by injecting five times, the mixed standard solution having a concentration of 50 µg/mL of derivative. The peak shapes of the drugs were symmetrical and the asymmetrical factor was less than 2.0. The system suitability data of quinolone derivative are shown in Table 2, and the respective calibration curves are shown in Fig.
Table 2: Calibration Curve Data
| Sr. No. | Concentration (µg/mL) | Peak Area |
| 1 | 10 | 52312.5 |
| 2 | 20 | 89924.0 |
| 3 | 30 | 157066.5 |
| 4 | 40 | 205618.5 |
| 5 | 50 | 254699.0 |
3.2.2 Linearity and Range
Linearity and range studies were conducted for the quinolone derivative. The response data demonstrated linearity within the concentration range of 100–50 µg/mL. A calibration curve was generated by plotting peak areas against the corresponding concentrations. The correlation coefficient (r²) value, based on five replicates (n=5), was found to be 0.994, confirming the linear relationship.
Table 1: Analytical performance parameter:
| Sr.no. | Parameter | Quinolone derivative |
| 1 | Linear dynamic range | 10-50 |
| 2 | Slope | 51047 |
| 3 | Intercept | 783.85 |
| 4 | Correlation Coefficient (r) | 0.994 |
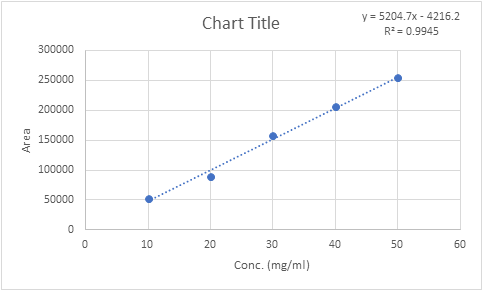
Fig 3: Calibration curve of sample solution
3.2.3. Repeatability
A total of six replicate injections of spiked samples were carefully examined to guarantee the analytical procedure’s reproducibility. The stability of retention durations and peak areas for anagrelide and its corresponding contaminants was the primary goal of this comprehensive precision assessment. To guarantee the method’s dependability for identifying and quantifying the target substances, every injection was meticulously examined to detect any changes. The analysis’s findings shed light on the method’s repeatability in the given experimental setting.
Table 6: Repeatability data of quinolone
| Sr. No. | Area | Retention Time |
| 1 | 53793 | 6.529 |
| 2 | 53319 | 6.527 |
| 3 | 53128 | 6.529 |
| 4 | 53826 | 6.543 |
| 5 | 53208 | 6.538 |
| 6 | 53479 | 6.524 |
| Mean | 53458.83 | 6.531667 |
| SD | 296.2455 | 0.007157 |
| %RSD | 0.554145 | 0.111108 |
3.2.4 Precision
3.2.4.1 Intraday
Table 4: Intraday precision data for quinolone derivative
| Concentration (μg/ml) | Peak area | Mean area | SD | %RSD | ||
| Set 1 | Set 2 | Set 3 | ||||
| 10 | 52287 | 156767 | 252435 | 52508 | 323.25 | 0.615 |
| 30 | 52879 | 155216 | 252678 | 155759.3 | 873.55 | 0.56 |
| 50 | 52358 | 155295 | 253988 | 253033.7 | 835.36 | 0.33 |
3.2.4.2 Interday
Table 5: Interday precision data for quinolone derivative
| Concentration (μg/ml) | Peak area | Mean area | SD | %RSD | ||
| Set 1 | Set 2 | Set 3 | ||||
| 10 | 52978 | 155259 | 254807 | 52513.6 | 402.149 | 0.765 |
| 30 | 52277 | 155803 | 253464 | 155447 | 308.46 | 0.198 |
| 50 | 52286 | 155279 | 253732 | 254001 | 710.76 | 0.279 |
The intraday precision of the quinolone was found to have a percentage relative standard deviation (%RSD) of less than 2%. This finding supports the conclusion that the suggested approach to quinolone derivative analysis is accurate and consistent even when run on the same day.
3.2.5 Accuracy
To generate spiked samples, the medicinal substance was meticulously mixed with contaminants in exact proportions, with the goal of achieving impurity levels at or beyond the thresholds needed for precision quantification. The percentage recovery values for each impurity consistently met the required limits, falling within the permissible range of about 50% to 150%. The low relative standard deviation (RSD) values (<2%) linked to the recovery of each impurity further substantiated the accuracy assessment, showing that the analytical technique was very precise and reliable. The stability and robustness of the method’s solutions were also thoroughly tested. The findings validate that the proposed methodology completely follows the criteria specified by the ICH recommendations. The analytical process was determined to be reliable, robust, and suitable for accurate and consistent analytical applications based on these findings.
Table 3: Recovery data of quinolone
| % Recovery | Conc.of Synthetic mixture | Conc. of Ciprofloxacin | Total amount | Area of synthetic mixture | Area of ciprofloxacin | Recovered amount of synthetic mixture | Recovered amout of ciprofloxacin | % Recovery of synthetic mixture | % recovery of ciprofloxacin | Mean (n=3)±SD |
| 50% | 20 | 10 | 30 | 154087 | 154987 | 19.8 | 10.2 | 99.12 | 102.00 | 101.63±0.351 |
| 20 | 10 | 155476 | 154085 | 20.4 | 9.8 | 102.00 | 98.24 | |||
| 20 | 10 | 154997 | 155486 | 20.3 | 10.1 | 101.67 | 101.57 | |||
| 100% | 20 | 20 | 40 | 164796 | 203948 | 20.1 | 20.2 | 100.51 | 101.94 | 100.13±0.404 |
| 20 | 20 | 165186 | 204886 | 19.7 | 19.8 | 98.57 | 99.62 | |||
| 20 | 20 | 163939 | 215184 | 20.2 | 20.4 | 101.34 | 102.14 | |||
| 150% | 20 | 30 | 50 | 162841 | 255745 | 19.8 | 30.2 | 99.89 | 100.66 | 99.13±0.611 |
| 20 | 30 | 163675 | 253942 | 20.4 | 29.8 | 102.00 | 99.33 | |||
| 20 | 30 | 165654 | 263765 | 20.3 | 30.3 | 101.75 | 101.76 |
Results obtained revealed that % recovery of quinolone was within the acceptance criteria given in ICH i.e. 98-102%.
3.2.6 Robustness
In compliance with the system appropriateness criteria outlined by the United States Pharmacopeia (USP), a deliberate alteration in chromatographic conditions was carefully implemented to assess the resilience of the validated analytical method. The robustness evaluation principally concentrated on the influence of the mobile phase flow rate on the method’s efficacy. A constant flow rate of 1.0 mL/min was utilized to assess its impact on essential peak features, specifically focusing on the resolution and tailing parameters for anagrelide and its related chemicals. The flow rate was systematically varied in increments of 0.1 mL/min, spanning from 0.9 to 1.1 mL/min, to investigate its effects. This assessment yielded significant insights into the method’s reliability amidst small operational modifications. The robustness research also encompassed a thorough examination of the impact of column temperature on the method’s efficacy. The column temperature was adjusted within a range of 30 ± 5°C to assess its impact on chromatographic parameters. This thorough evaluation validated the method’s robustness and adherence to USP standards, confirming its appropriateness for dependable analytical uses.
Table 7: Robustness
| Parameter | Condition | Retention Time | Area |
| Flow rate | 1.1 | 6.548 | 667128 |
| 0.9 | 6.526 | 663698 | |
| Mobile phase | 75:25:00 | 6.562 | 659892 |
| 65:35:00 | 6.543 | 661879 | |
| Column temperature | 35 | 6.546 | 654387 |
| 45 | 6.593 | 672968 |
3. Summary
| Sr. No. | Validation Parameter | Synthesized quinolone derivative |
| 1 | Linearity | |
| Regression Equation | Y= 5184.6x – 5048.1 | |
| Regression Coefficient | R2 = 0.994 | |
| 2 | Range | 10-50 (μg/mL) |
| 3 | Accuracy | |
| 50% | 101.63±0.351 | |
| 100% | 100.13±0.404 | |
| 150% | 99.13±0.611 | |
| 4 | Precision (%RSD) | |
| Intraday (10 μg/ml) | 0.615 | |
| 30 (μg/ml) | 0.56 | |
| 50 ( μg/ml) | 0.33 | |
| Interday (10 μg/ml) | 0.765 | |
| 30 (μg/ml) | 0.198 | |
| 50(μg/ml) | 0.279 | |
| Robustness | Robust | |
| 5 | LOD (μg/mL) | 14.72 |
| 6 | LOQ (μg/mL) | 49.07 |
4. Conclusion
The validated HPLC method for the synthesized quinolone derivative exhibits exceptional accuracy, precision, and robustness. The approach demonstrated superior linearity within a concentration range of 10–50 μg/mL, exhibiting a robust correlation coefficient (R²) of 0.994, and was verified per ICH requirements. Repeatability was confirmed using intra-day and inter-day precision evaluations, demonstrating negligible variance and guaranteeing consistent performance. The recovery rates of 98% to 102% underscore the method’s accuracy and robustness across diverse chromatographic settings. These results validate the method’s dependability and appropriateness for standard analysis and quality control purposes. The suggested HPLC method provides a robust and reliable instrument for the quantitative measurement of quinolone derivatives in both bulk and tablet forms, rendering it extremely suitable in pharmaceutical contexts.
Funding: Author did not receive any funding for this research work
Conflict of interest- There are no conflicts to declare.
References
- Paul Y, Dhake AS, Parle M, Singh B. In Silico Quantitative Structure Pharmacokinetic Relationship Modeling for Quinolone Drugs: Biological Half-Life. Asian Journal of Chemistry. 2010 Jul 1;22(6):4880.
- Gupta AK, Agarwal AK, Mehra SC. Synthesis of Some Quinolone Derivatives with Possible Local Anaesthetics Activities. Asian Journal of Chemistry. 2012 May 1;24(5):2359.
- Ramasamy AK, Balasubramaniam V, Mohan K. Synthesis and Characterization of Substituted 4-Methoxy-1H-quinolin-2-thiones. Asian Journal of Chemistry. 2012 Oct 1;24(10).
- D.C. Hooper, J.S. Wolfson, Quinolone Antimicrobial Agents, 2nd ed., American Society for Microbiology, Washington, DC, 1993.
- Commission of the European Communities, Diario Oficial de las Comunidades Europeas (DOCE) 2377/90 L224, 991, 2608, 18 August 1990.
- Hernández-Arteseros JA, Barbosa J, Compano R, Prat MD. Analysis of quinolone residues in edible animal products. Journal of Chromatography A. 2002 Feb 1;945(1-2):1-24.
- Belal F, Al-Majed AA, Al-Obaid AM. Methods of analysis of 4-quinolone antibacterials. Talanta. 1999 Nov 15;50(4):765-786.
- Gurjar VK, Pal D, Mazumder A, Mazumder R. Synthesis, Biological Evaluation and Molecular Docking Studies of Novel 1, 8-Naphthyridine-3-carboxylic Acid Derivatives as Potential Antimicrobial Agents (Part-1). Indian Journal of Pharmaceutical Sciences. 2020 Jan 1;82(1).
- Drlica K, Hiasa H, Kerns R, Malik M, Mustaev A, Zhao X. Quinolones: action and resistance updated. Current topics in medicinal chemistry. 2009 Aug 1;9(11):981-998.
- Dalhoff A. Resistance surveillance studies: a multifaceted problem—the fluoroquinolone example. Infection. 2012 Jun;40:239-262.
- Hooper, D. C. (1999) Mode of action of fluoroquinolones. Drugs 58 (Suppl. 2), 6−10
- Drlica K, Malik M, Kerns RJ, Zhao X. Quinolone-mediated bacterial death. Antimicrobial agents and chemotherapy. 2008 Feb;52(2):385-392.
- Emmerson AM, Jones AM. The quinolones: decades of development and use. Journal of Antimicrobial Chemotherapy. 2003 May 1;51(suppl_1):13-20.
- Mitscher LA. Bacterial topoisomerase inhibitors: quinolone and pyridone antibacterial agents. Chemical reviews. 2005 Feb 9;105(2):559-592.
- Drlica K, Hiasa H, Kerns R, Malik M, Mustaev A, Zhao X. Quinolones: action and resistance updated. Current topics in medicinal chemistry. 2009 Aug 1;9(11):981-998
- Hooper DC. Emerging mechanisms of fluoroquinolone resistance. Emerging infectious diseases. 2001 Mar;7(2):337.
- Guan X, Xue X, Liu Y, Wang J, Wang Y, Wang J, Wang K, Jiang H, Zhang L, Yang B, Wang N. Plasmid-mediated quinolone resistance–current knowledge and future perspectives. Journal of International Medical Research. 2013 Feb;41(1):20-30.
- Gurjar VK, Pal D. Design, in silico studies, and synthesis of new 1, 8-naphthyridine-3-carboxylic acid analogues and evaluation of their H1R antagonism effects. RSC advances. 2020;10(23):13907-13921.
- Gurjar VK, Pal DD. Design, synthesis, biological evaluation, and in silico ADMET studies of 1, 8-naphthyridine derivatives as an H1-receptor inhibitor. International Journal of Pharmaceutical & Biological Archive. 2018 Dec 15;9(4):265-273.
- Gurjar VK, Pal D. Design, in silico studies, and synthesis of new 1, 8-naphthyridine-3-carboxylic acid analogues and evaluation of their H1R antagonism effects. RSC advances. 2020;10(23):13907-21.
- Gurjar VK, Pal DI. Recent developments and multiple biological activities available with 1, 8-naphthyridine derivatives: a review. International Journal of Pharmacy and Pharmaceutical Sciences. 2019;11(1):17-37.
- Gurjar VK, Pal D, Patel AD. Recent advances in chemistry and synthesis of pyrazole derivatives as potential promising antimicrobial agents. Pyrazole preparation and uses. 2020.
- Gurjar VK, Pal DD. Design, synthesis, biological evaluation, and in silico ADMET studies of 1, 8-naphthyridine derivatives as an H1-receptor inhibitor. International Journal of Pharmaceutical & Biological Archive. 2018 Dec 15;9(4):265-73.
- Gurjar VK, Pal D. Classification of Medicinal Plants Showing Anti-Viral Activity, Classified by Family and Viral Infection Types. InAnti-Viral Metabolites from Medicinal Plants 2023 Nov 1 (pp. 97-195). Cham: Springer International Publishing.
- GURJAR VK, SHUKLA S, GONDALIYA N, PUWAR N. Design, Synthesis, In silico Study and Biological Evaluation of 1, 8-Naphthyridine Derivatives as Potential Antibacterial Agents. Oriental Journal of Chemistry. 2023 Mar 1;39(2).
- Pal D, Gurjar VK. Application of TGA and DTA to Polymeric Systems (Neat Polymeric Systems). InPolymers and Multicomponent Polymeric Systems 2019 Dec 6 (pp. 37-71). CRC Press.